![]() Listen to the bonus interview:
Listen to the bonus interview:
Katie Luu: From MIT, this is the Energy Initiative. I’m Katie Luu. Today we’re talking with Valerie Karplus, assistant professor of global economics and management at the Sloan School.
Your research is looking at the ramifications of the government response to “airpocalypse”. Can you talk more about your work with power plant emissions and mentioned satellite data?
Valerie Karplus: If we go to China today, and actually, you mention the airpocalypse. Rewinding to 2013, the airpocalypse was a series of weeks in January when residents of mainly the northeastern part of China, particularly Beijing, because Beijing is so populous, many residents were affected by it but actually much of the northeastern part of China was really suffering from an extended episode of degraded air. The accounts of the concentrations of particulate matter were off the charts relative to any standard scale that is used internationally and well above World Health Organization measures of safe levels. When you walked around Beijing you couldn’t see your hand in front of your face. I remember back in grade school in the 80s seeing these doomsday visions of what environmental destruction looks like. I wasn’t in Beijing at that time but I was doing a lot of work in Beijing and was in Beijing during some severe orange alert episodes that happened later in that year. The air quality was basically unbreathable. Many residents stayed inside. I think the health toll is really significant. One of the leading risk factors for death in China, and India as well, and other developing countries, is degraded air. I think the airpocalypse was, more than anything else in China’s recent history, a wakeup call and a realization how bad this problem is. There were efforts. Journalists began to write about the problem of air pollution in China around that time, really bringing it to the forefront of the public mind. If you look back before, you had people referring to degraded air around Beijing. When I first went to Beijing in 2002, we referred to it as fog as well. The Chinese word for fog was what everyone thought the pollution was. Now that awareness has really changed dramatically as a result, first of the airpocalypse, but then a series of additional episodes of degraded air that unfolded over the years since then.
I think what’s really exciting about the work that we published, and that’s written up in Energy Futures, is the idea that developing countries, governments are looking at the increasing threat of air pollution as one additional public policy challenge that they’re increasingly trying to meet by adopting standards and policies. These standards and policies, many governments in developing countries have adopted standards and policies that look actually quite similar to those that are introduced in developed countries.
But the biggest challenge is understanding whether those standards and policies are actually being implemented on the ground. What’s happening at the plant level? That’s not something we have a lot of insight into. Even in the developed countries, I think there are reasonably good sources of data, but they’re not always so easy to get. We often forget to look at what plants are actually doing and what they’re doing from hour to hour, day to day.
What our research starts to unpack and understand, in the Chinese context, is how are power plants in China that are newly being asked to monitor their pollution coming out of their stacks, is, are plants complying with new regulations? What’s happening at the ground level, and is pollution actually falling? I think what our research does is to say, all right, we have essentially two independent from each other data sources. We have plant level measures that are readings that are coming out of plant smokestacks and we’re putting those next to readings that satellites, NASA’s Aura satellite and the ozone monitoring instrument, are providing to us. In particular, we’re looking at SO2 readings, the column amounts of SO2, in specific locations across China. We’re matching those up with what plants are saying they’re doing in terms of their plant level stack emissions. With that information we can say, first of all, how did a new standard for SO2 change what plants actually did? Are plants meeting standards? Which are usually written in terms of concentrations of the pollutant coming out of the stack. Are those levels reducing around the policy deadline? Which, in July of 2014, all plants had to meet new accelerated standards for air pollution, or the concentration of air pollutants that they were emitting. How does that correspond to what we see in the satellite data? The satellite data really provides an objective check on what the plants are reporting. What we are really interested in is the match between what the plant data are saying and satellite data are saying.
An interesting question we were able to ask in this research was to say, first of all, how much are plant emissions changing on the policy deadline? Are they changing differently in different places as a function of policy stringency? There the policy was differentiated between areas that were essentially more populated, where more population was at risk from local air pollution. These were called the three key regions: an area around Beijing, an area generally around Shanghai, the Yangtze River Delta, and then in the south, in the Pearl River Delta. These were areas that were under intense scrutiny, also because they are major centers of commerce and areas where there’s a rising middle class. I think these areas were singled out as areas for tighter control. We compare what happened in those areas to what happened in the rest of China. In those three areas, the three big regions that I mentioned, you have air pollution standards that were significantly tighter after the introduction of the new standard relative to those areas in the other parts of the country. These plants in these areas were asked to meet a 50 mg per cubic meter standard for their SEMs emissions relative to a 200 mg per cubic meter standard, which was the standard in the rest of the country.
What we’re able to do is say, is there any difference in the extent to which the plant data match the satellite data as a function of that policy stringency? We do indeed see a difference. We see that in the areas where plants were facing a less stringent increase in the policy requirement, we see much more evidence that the reduction in the satellite data match the plant data, and indeed suggests that the plants are reporting accurately. Whereas in these three key regions, with the isolated plants that we have, we have to use isolated plants because we don’t want emissions from other industrial neighboring sources to interfere, we use this across the board and consistently in the analysis, we find for those plants in the key regions, we actually don’t find evidence that the reductions reported at the plants are recorded in the satellite data, which we trust to be the objective measure. That suggests to us that, it’s hard to know, but suggestive evidence that these tougher standards may have pushed firms into a situation where they might have taken steps to manipulate the data rather than to change the underlying pollution control levels.
KL: A lot of people talk about carbon dioxide these days but your research today focuses on sulfur dioxide, which is what causes the air pollution. Can you talk more about what inspired you to go down that path of air pollution?
VK: We focus on sulfur dioxide in this work because it’s one of the major precursors to the formation of fine particulate matter. Which is one of the leading causes of the health effects of air pollution that we see in terms of cardiac and respiratory problems. The special thing about sulfur dioxide, we could have looked at a broader range of pollutants here, but in this case, sulfur dioxide is really a proxy. It’s emitted by large industrial facilities and specifically by coal-fired power plants. It’s not emitted from vehicles. It gives us a good signature on, what are these plants emitting? We need that because we’re using satellite data and plant-level data and we’re putting it together. The satellite data would pick up all sources of SO2 in a given area. If we used a different pollutant, we would be picking up additional maybe transportation sources. SO2 in its own right has adverse cardiac and respiratory effects but it contributes to the formation of even this fine particulate matter, PM2.5, which you hear in China these days is actually a standard part of people’s vocabulary now.
KL: A couple of questions to follow up on this. One would be, how are you accessing the information from the power plants and from the NASA satellite? Is it publicly available or did you have to pull some strings?
VK: The NASA data are publicly available. I think this is also a tremendously important resource. You think about needing an independent check, regardless of where you are on earth. In our analysis for China we use the NASA data and compare them to the SEMs data, the plant-level stack measurements, for the very first time. But similar studies looking at correspondence between satellite and ground measurements have been performed for the United States and for other countries and having these publicly available data sources is a godsend if you want to conduct this kind of detailed research. Also, for regulators, I think it will play a very important role going forward in helping regulators identify anomalies.
I think it’s really to the credit of China’s Ministry of Ecology and Environment that the plant-level hourly emissions data are required to be posted online. Researchers in China are really benefiting from this as well. It provides a tremendous new resource for regulators, for researchers, for scientists. I think this is perhaps one of the most exciting things about doing this research was bringing this… you have to, of course, scrape the data and clean the data very carefully in order to ensure that you’re using valid data. Once we did that, though, I think we feel very confident that these data are providing a whole range of new insights into how plants are responding to regulation.
KL: How did you first become interested in energy and policy in China? It’s safe to say you’re an expert, so we just want to hear where your path, where you came from.
VK: I’ve been fascinated with the developments in China since I finished college, I guess it was around 2002. That was right after China joined the World Trade Organization and was really starting to emerge on the world stage. As an increasingly interesting case of how a country was really sustaining economic growth over a long period, providing opportunity to hundreds of millions of people on a scale that history had never seen. This type of transition fascinated me. I didn’t know much about China at that time but I was fascinated with the developments that were happening.
I received a Luce Fellowship, which sends young Americans to China who have no experience with the Chinese language or culture. It was a sink-or-swim, fascinating experience for a year. It was during my time there that I became deeply immersed in some of the questions that, at the time I was studying biotechnology but you couldn’t ignore the air all around you. The fog, as I mentioned, was also quite present still at that time, in the middle of China’s industrial development. I became fascinated with the challenges of energy transition that the country was going to be facing as it developed and as households began to ask for better quality of life. That began to include things like clean air, clean water, alongside the sort of portfolio of economic possibilities that I think comes with development.
I think that living there and working out alongside people, I began to also very strongly identify with many of my colleagues and understand their increasingly present concern about air quality and environmental degradation and also understand, in terms of how China’s energy system is governed, how important it is to get the incentives right and moving towards lower carbon sources of energy in that country.
I came back actually to MIT in 2006. It took a while to be able to really focus my work on China. I learned a tremendous amount in the interim. But I was very involved in projects during that time, and in particular a collaboration with Tsinghua for five years which led to a tremendous number of insights into the possibilities for low-carbon transition in China.
KL: I think you mentioned India earlier. On your detour between the Luce Fellowship and then coming back to MIT, did you look at other Asian countries as well?
VK: I think pollution as a byproduct of industrial development is a challenge facing all developing countries at some stage. Unless you’re fortunate to have a carbon-free energy system by virtue of availability of natural resources. A lot of this is very path-dependent though. Places like India, China, South Africa still rely heavily on coal. There are huge challenges facing countries across Africa. In terms of moving away from carbon-intensive sources without taxing their economic growth trajectories over the longer-term.
In my recent past research, we’ve looked also at several countries in Africa and the uptake and impact of solar energy, as well as you mentioned Asia, and India is of course struggling with severely degraded air. We’re actually looked at, on the energy side, some of the implications of different pathways for meeting India’s climate targets. We haven’t looked at air pollution explicitly yet but that would be a natural next step. There’s also new research going on in India focusing on the continuous emissions monitoring systems that we use in China. Which is really exciting, out of the University of Chicago. I think that more researchers are really seeing and accessing the value that these data, these high frequency and increasingly reliable, well, you can check that, but that these data have to offer.
KL: I think that’s great that other researchers are seeing the value in this. Are you working currently with any researchers at other institutions for studies you just mentioned?
VK: Yes. I should say, the present study is carried out with researchers at Columbia University and University of Colorado at Boulder. My co-authors, Douglas Almond and Shuang Zhang, were absolutely instrumental. This work is really the joint product of a broader effort to try to make accessible the SEMs data and to understand patterns in the SEMs data for China.
In terms of other projects, definitely. I’ve had the pleasure of working with some terrific MIT… actually the MIT Tata Center supported a graduate student who did a lot of the work together with a principal research scientist in the Global Change Program here at MIT. It was just accepted in Climate Change Economics. Other projects continue to build on the momentum that we established in the China Energy and Climate Project, which was a major effort between 2011 and 2016. That’s a collaboration with colleagues at Tsinghua University in Beijing. These are China’s leading experts on air pollution, on energy, on climate change. Many of them are still strongly engaged. We just had a postdoc return to Tsinghua to get an assistant professorship there. We continue to actively collaborate on these issues. I’m really excited about what the next iteration of this research will bring. You can think of this research as being more broadly part of an area you might think of as pollution forensics, and energy and pollution forensics. Trying to understand what’s actually happening on the ground and comparing that to what policy has required and thinking about what that can say about how we can make policy more effective.
KL: You write, you research, and you also teach at the Sloan School. How does your research influence your courses and vice-versa?
VK: This a great question. I would say that there’s a way that China broadly has strongly influenced my teaching interests. I teach an action learning course, which is a hallmark of Sloan’s education offerings. It’s basically sending students to work with companies over the course of a semester but also on site. In the case of China, that involves travel over two weeks in the middle of the semester. It’s really a hands-on experience in understanding how business is really done on the ground in China and gaining an appreciation for the new business trends. That is offered every spring.
I also teach a course that is really much closer to my research, global energy politics, markets, and policies, in the sense that it has a lot of discussion, and interaction also with practitioners around the question of, how do you reimagine the energy system? How do you orchestrate a transition to lower carbon energy sources? How do you do that at multiple levels? At the level of the business firm, the individual, all the way up to states, regions, countries, and then, of course, at the global level. We have the students negotiate a global climate agreement as part of that course. The Climate Interactive has a terrific simulation. Colleagues at MIT have really facilitated the possibility to bring that into the classroom in the context of this course. Students have the opportunity to simulate a negotiation and then understand viscerally what it means to commit to actions at the national level that ultimately need to add up to global goals and levels of ambition that are needed to address the climate problem, keep temperature rise below two degrees Celsius. It’s not easy. In the past few years we’ve had, only one of my classes has reached that goal. But indeed, it’s much more the journey of understanding how fraught and how challenging and how complex that changes that need to take place in order to address the problem are something that students really come away with after something like that. I think on multiple fronts, both the China and the energy elements connect closely with my teaching.
KL: What is something most people would be surprised to learn about global energy policy or policy in China?
VK: One thing that was really surprising to me was actually that, within China there are, you think of China perhaps from the outside as a unified actor, as having a single mind. But within China, there are a lot of… indeed it’s true, in any complex nation you have a lot of different interests, different stakeholders. The idea that China could convert its energy system to renewables tomorrow if it just had the political will, I think is actually it’s actually far from the truth. If you think about the challenges of evolving a system, you have stakeholders on both, on many sides of the issue, actually. The local level, the national level. You have consumers who are increasingly representing their interests in keeping prices low. How these, the political economy of energy system transition in China I think is different, but it’s just as complex as it is in many other parts of the world.
KL: One thing that I came across when I was preparing for this is, and you had mentioned it, is there have been since the 2013 airpocalypse episode, there have been other episodes of degraded air quality in China. I saw another airpocalypse referred to in the Financial Times from December 2016 talking about Beijing. It was saying that flights were cancelled and even restaurants were forbidden from running their fires to roast duck for a time being. It was so bad that they also restricted traffic. They only let vehicles with odd-numbered license plates go on one day and even on another. You can imagine that impacts so many things in terms of making deliveries for businesses. It’s just amazing to me what a standstill airpocalypse causes in a nation like this. Also, in that article, they were saying that there’s a tension between China wanting to really cut back on the emissions but also wanting to stimulate industry and make sure that they’re not holding industry back from the economic side of things. I’m wondering what you think of all of this.
VK: I think the reality is that there’s a real challenge that China’s policymakers face. Environmental damage has a negative effect on the economy, that much is true. That has continued to mount to the point where I think policymakers have started to acknowledge that indeed some investment environmental protection is actually good for the economy and that those benefits will be captured by businesses, by people. Fewer hospital visits. Generally higher labor productivity. There are ways in which addressing pollution is aligned with growing the economy. But on the other hand, you can also see ways in which tougher regulations will impose costs. Those costs will be fairly concentrated on emitting businesses, and to some extent households.
I think that it’s really important to put in place the types of policy mechanisms that will give flexibility to minimize the costs on businesses and for those the emitters to have the opportunity to try to identify what are the least-cost ways of reducing emissions and meeting the goal. I think that’s partly where these longer-term targets come in. If I set the finish line little further out but the target is a little tougher, it might be less costly in fact for me to meet that than it would be for me to meet a less stringent short-term target. Thinking carefully about how to incorporate the type of flexibility while still meeting environmental targets is going to be the name of the game. That’s not just going to come from the top down. That will partially come from building an awareness and changing mindsets and approaches within local governments. Increasing the seriousness of enforcement and so forth. There’s a lot of capabilities building that will need to be done in order to support the implementation of policies. I think the first step is recognition of the magnitude of the problem, and the second is thinking about how can we create the flexibility and incentivize the transition that is compatible with economic goals.
KL: Could you let us know where people can keep up to speed with your latest research? Do you have a website or Twitter feed?
VK: I try to tweet about all of my new research, you can follow me @vjkarplus on Twitter. I also have a website, just simply vkarplus.com. That will provide the full picture on where our publications are and potentially any new working papers that are coming out soon. I encourage everyone also just to stay tuned. I think MIT News is also a great place to see what folks at MIT are doing. Our research is sometimes featured there. It’s a good way to keep up with what’s happening.
KL: Absolutely. Thank you so much, Valerie. It was such a pleasure to talk to you about all of this.
VK: Thank you so much. This is a lot of fun. I appreciate it.
In brief
An MIT investigator and her colleagues have confirmed that power plant emissions in China declined when strict new limits went into effect in 2014—but the response by plants was not uniform. They compared sulfur dioxide (SO2) concentrations measured at power plant stacks with atmospheric SO2 concentrations detected by satellite in the same area. In highly populated regions that faced the toughest new limits, the satellite data didn’t show the large reductions reported by power plants—a sign that some firms may have falsified their stack measurements, perhaps due to the difficulty of meeting the tighter standards. The study shows the importance of setting clear, long-term emissions targets that give plants time to adjust, and it demonstrates an effective means of monitoring compliance.
In January 2013, many people in Beijing experienced a multiweek period of severely degraded air, known as the “Airpocalypse,” which made them sick and kept them indoors. As part of its response, the central government accelerated implementation of tougher air pollution standards for power plants, with limits to take effect in July 2014. One key standard limited emissions of SO2, which contributes to the formation of airborne particulate pollution and can cause serious lung and heart problems. The limits were introduced nationwide but varied by location. Restrictions were especially stringent in certain “key” regions, defined as highly polluted and populous areas in Greater Beijing, the Pearl River Delta, and the Yangtze River Delta.
All power plants had to meet the new standards by July 2014. So how did they do? “In most developing countries, there are policies on the books that look very similar to policies elsewhere in the world,” says Valerie J. Karplus, an assistant professor of global economics and management at the MIT Sloan School of Management. “But there have been few attempts to look systematically at plants’ compliance with environmental regulation. We wanted to understand whether policy actually changes behavior.”
Focus on power plants
For China, focusing environmental policies on power plants makes sense. Fully 60% of the country’s primary energy use is coal, and about half of it is used to generate electricity. With that use comes a range of pollutant emissions. In 2007, China’s Ministry of Environmental Protection required thousands of power plants to install continuous emissions monitoring systems (CEMS) on their exhaust stacks and to upload hourly, pollutant-specific concentration data to a publicly available website.
Among the pollutants tracked on the website was SO2. To Karplus and two colleagues—Shuang Zhang, an assistant professor of economics at the University of Colorado, Boulder, and Douglas Almond, a professor in the School of International and Public Affairs and the Department of Economics at Columbia University—the CEMS data on SO2 emissions were an as-yet-untapped resource for exploring the on-the-ground impacts of the 2014 emissions standards, over time and plant by plant.
To begin their study, Karplus, Zhang, and Almond examined changes in the CEMS data around July 2014, when the new regulations went into effect. Their study sample included 256 power plants in four provinces, among them 43 that they deemed “large,” with a generating capacity greater than 1,000 megawatts (MW). They examined the average monthly SO2 concentrations reported by each plant starting in November 2013, eight months before the July 2014 policy deadline.
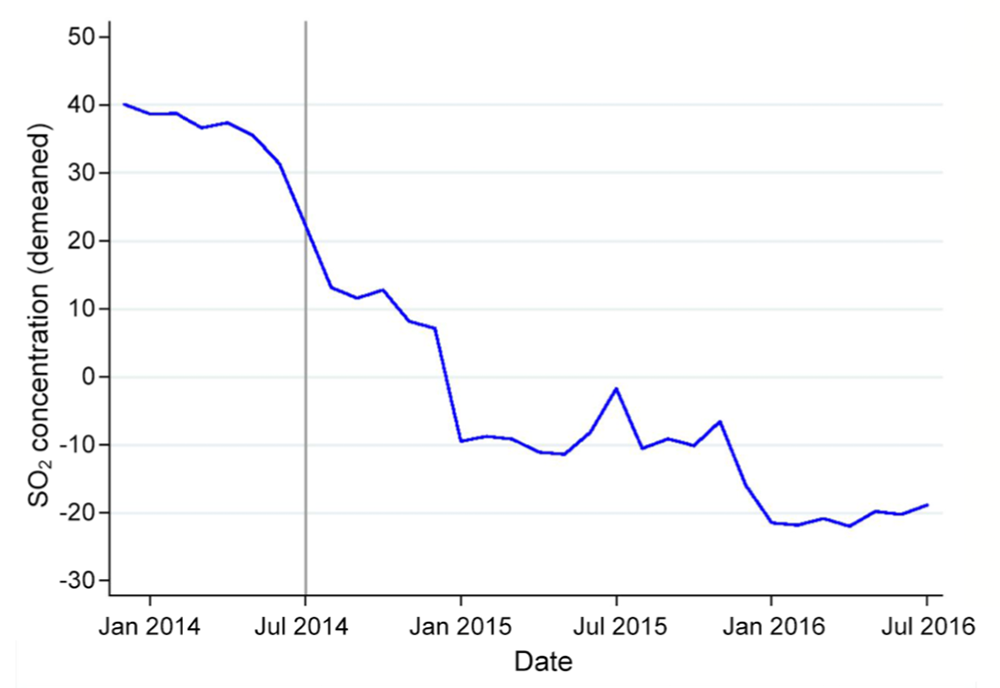
Emissions levels from the 256 plants varied considerably. The researchers were interested in relative changes within individual facilities before and after the policy, so they determined changes relative to each plant’s average emissions—a calculation known as demeaning. For each plant, they calculated the average emissions level over the whole time period being considered. They then calculated how much that plant’s reading for each month was above or below that baseline. By taking the averages of those changes-from-baseline numbers at all plants in each month, they could see how much emissions from the group of plants changed over time.
The demeaned CEMS concentrations are plotted in the figure below. At zero on the Y axis, levels at all plants—big emitters and small—are on average equal to their baseline. Accordingly, in January 2014 plants were well above their baseline, and by July 2016 they were well below it. So average plant-level SO2 concentrations were declining slightly before the July 2014 compliance deadline, but they dropped far more dramatically after it.
Checking the reported data
Based on the CEMS data from all the plants, the researchers calculated that total SO2 emissions fell by 13.9% in response to the imposition of the policy in 2014. “That’s a substantial reduction,” notes Karplus. “But are those reported CEMS readings accurate?”
To find out, she, Zhang, and Almond compared the measured CEMS concentrations with SO2 concentrations detected in the atmosphere by NASA’s Ozone Monitoring Instrument. “We believed that the satellite data could provide a kind of independent check on the policy response as captured by the CEMS measurements,” she says.
For the comparison, they limited the analysis to their 43 1,000-MW power plants—large plants that should generate the strongest signal in the satellite observations. The figure below shows data from both the CEMS and the satellite sources. Patterns in the two measures are similar, with substantial declines in the months just before and after July 2014. That general agreement suggests that the CEMS measurements can serve as a good proxy for atmospheric concentrations of SO2.
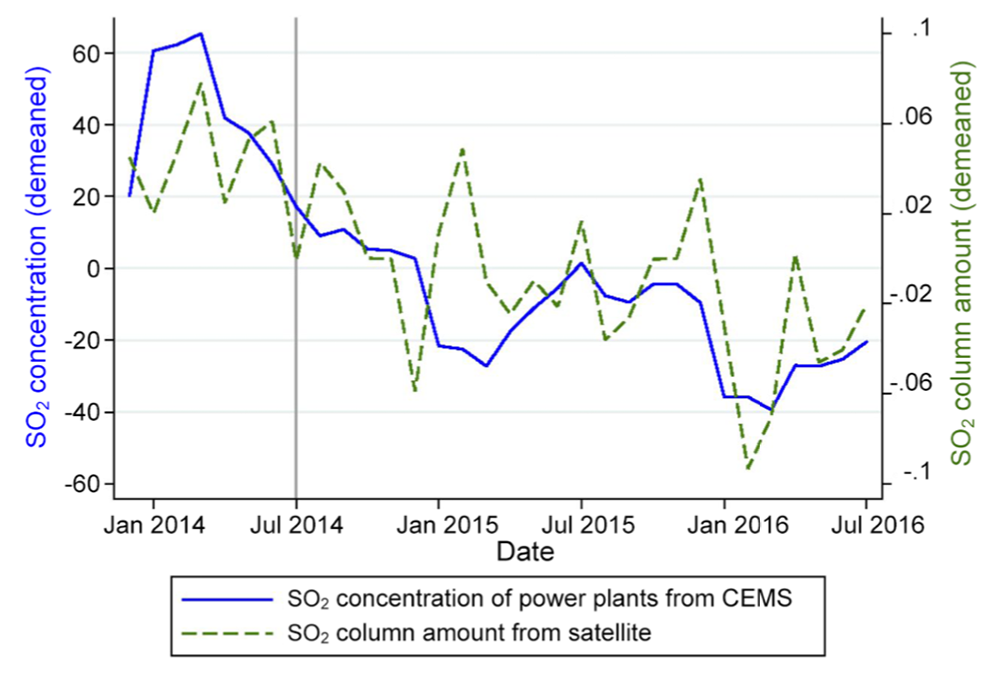
To double-check that outcome, the researchers selected 35 relatively isolated power plants whose capacity makes up at least half of the total capacity of all plants within a 35 km radius. Using that restricted sample, they again compared the CEMS measurements and the satellite data. They found that the new emissions standards reduced both SO2 measures. However, the SO2 concentrations in the CEMS data fell by 36.8% after the policy, while concentrations in the satellite data fell by only 18.3%. So the CEMS measurements showed twice as great a reduction as the satellite data did. Further restricting the sample to isolated power plants with capacity larger than 1,000 MW produced similar results.
Key versus non-key regions
One possible explanation for the mismatch between the two datasets is that some firms overstated the reductions in their CEMS measurements. The researchers hypothesized that the difficulty of meeting targets would be higher in key regions, which faced the biggest cuts. In non-key regions, the limit fell from 400 to 200 milligrams per cubic meter (mg/m3). But in key regions, the limit went from 400 to 50 mg/m3. Firms may have been unable to make such a dramatic reduction in so short a time, so the incentive to manipulate their CEMS readings may have increased. For example, they may have put monitors on only a few of all their exhaust stacks or turned monitors off during periods of high emissions.
The table below shows results from analyzing non-key and key regions separately. At large, isolated plants in non-key regions, the CEMS measurements show a 29.3% reduction in SO2 and the satellite data a 22.7% reduction. The ratio of the estimated post-policy declines is 77%—not too far out of line.
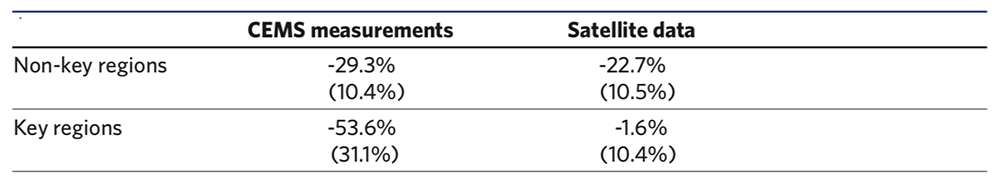
But a comparable analysis of large, isolated plants in key regions produced very different results. The CEMS measurements showed a 53.6% reduction in SO2, while the satellite data showed no statistically significant change at all.
One possible explanation is that power plants actually did decrease their SO2 emissions after 2014, but at the same time nearby industrial facilities or other sources increased theirs, with the net effect being that the satellite data showed little or no change. However, the researchers examined emissions from neighboring high-emitting facilities during the same time period and found no contemporaneous jump in their SO2 emissions. With that possibility dismissed, they concluded that manipulation of the CEMS data in regions facing the toughest emissions standards was “plausible,” says Karplus.
Compliance with the new standards
Another interesting question was how often the reported CEMS emissions levels were within the regulated limits. The researchers calculated the compliance rate at individual plants—that is, the fraction of time their emissions were at or below their limits—in non-key and key regions, based on their reported CEMS measurements. The results appear in the figure below. In non-key regions, the compliance rate at all plants was about 90% in early 2014. It dropped a little in July 2014 when plants had to meet their (somewhat) stricter limits and then went back up to almost 100%. In contrast, the compliance rate in key regions was almost 100% in early 2014 and then plummeted to about 50% at and after July 2014.
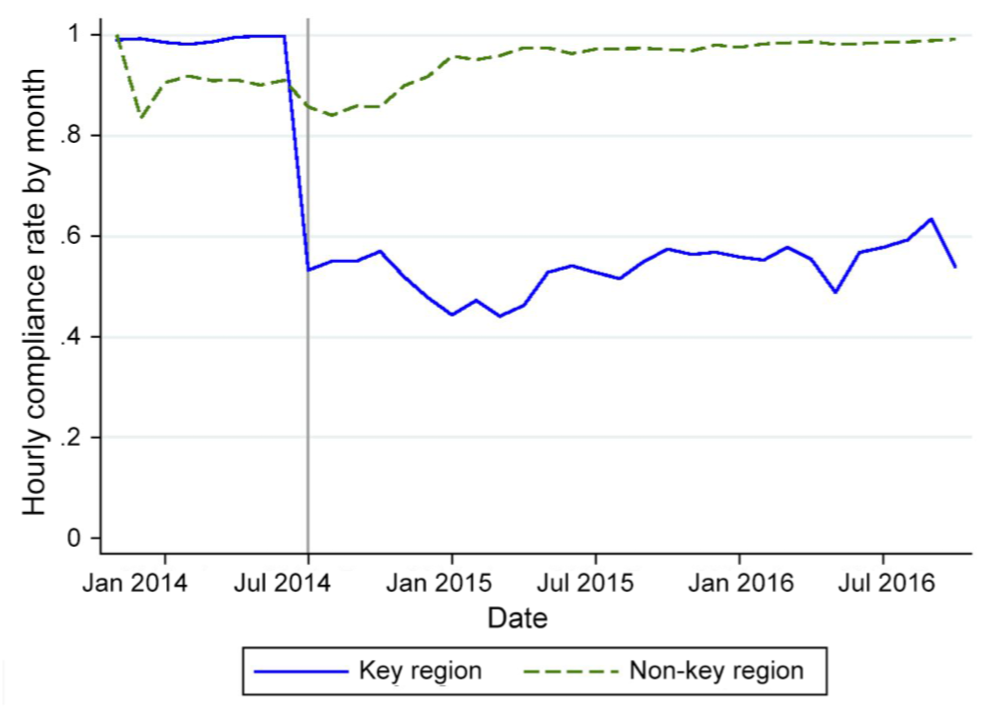
Karplus, Zhang, and Almond interpret that result as an indication of the toughness of complying with the stringent new standards. “If you think about it from the plant’s perspective, complying with tighter standards is a lot harder than complying with more lenient standards, especially if plants have recently made investments to comply with prior standards, but those changes are no longer adequate,” she says. “So in these key regions, many plants fell out of compliance.”
She makes another interesting observation. Their analyses had already produced evidence that firms in key areas may have falsified their reported CEMS measurements. “So that means they could be both manipulating their data and complying less,” she says.
Encouraging results plus insights for policymaking
Karplus stresses the positive outcomes of their study. She’s encouraged that the CEMS and satellite data both show emission levels dropping at most plants. Compliance rates were down at some plants in key regions, but that’s not surprising when the required cuts were large. And she notes that even though firms may not have complied, they still reduced their emissions to some extent as a result of the new standard.
She also observes that, for the most part, there’s close correlation between the CEMS and satellite data. So the quality of the CEMS data isn’t all bad. And where it’s bad—where firms may have manipulated their measurements—it may have been because they’d been set a seemingly impossible task and timeline. “At some point, plant managers might just throw up their hands,” says Karplus. The lesson for policymakers may be to set emissions-reduction goals that are deep but long-term so that firms have enough time to make the necessary investment and infrastructure adjustments.
To Karplus, an important practical implication of the study is “demonstrating that you can look at the alignment between ground and remote data sources to evaluate the impact of specific policies.” A series of tests confirmed the validity of their method and the robustness of their results. For example, they performed a comparable analysis focusing on July 2015, when there was no change in emissions standards. There was no evidence of the same effects. They accounted for SO2 emitted by manufacturing facilities and other sources, and their results were unaffected. And they demonstrated that when clouds or other obstructions interfered with satellite observations, the resulting data gap had no impact on their results.
The researchers note that their approach can be used for other short-lived industrial air pollutants and by any country seeking low-cost tools to improve data quality and policy compliance, especially when plants’ emissions are high to begin with. “Our work provides an illustration of how you can use satellite data to obtain an independent check on emissions from pretty much any high-emitting facility,” says Karplus. “And over time, NASA will have instruments that can take measurements that are even more temporally and spatially resolved, which I think is quite exciting for environmental protection agencies and for those who would seek to improve the environmental performance of their energy assets.”
This research was supported by a seed grant from the Samuel Tak Lee Real Estate Entrepreneurship Laboratory at MIT and by the U.S. National Science Foundation. Further information can be found in:
V.J. Karplus, S. Zhang, and D. Almond. “Quantifying coal power plant responses to tighter SO2 emissions standards in China.” Proceedings of the National Academy of Sciences of the United States of America, vol. 115, no. 27, pp. 7004-7009, June 2018. Online: doi.org/10.1073/pnas.1800605115.
This article appears in the Autumn 2019 issue of Energy Futures.