
Chairman Bingaman, Senator Murkowski, and Members of the Committee, thank you for the opportunity to present some of the key results of the recently published MIT multi-disciplinary study, The Future of Natural Gas. The study looks at:
- the economics and uncertainty of supply;
- the role of natural gas in the overall energy system, especially in the context of constraints on greenhouse gas emissions;
- the opportunities for capitalizing on an abundant natural gas supply in the electricity, industry, buildings and transportation sectors;
- infrastructure needs;
- global markets and geopolitical implications; and
- the needs for natural gas-related research and development.
The Future of Natural Gasstudy is the fourth in a series that presents the results of an integrated technically-grounded analysis, carried out by a multi-disciplinary group of MIT faculty, senior researchers and students, aimed at elucidating the steps needed to provide marketplace options for a clean energy future. The first three studies addressed nuclear power, coal and the nuclear fuel cycle; studies of the grid and of solar energy are in progress. We feel that the earlier studies have contributed constructively to the energy technology and policy debate in the U.S. and hope that the natural gas study will as well. In that context, we are very appreciative of the opportunity to present today.
Prior to carrying out our analysis, we had an open mind as to whether natural gas would indeed be a “bridge” to a low-carbon future. While it is the least carbon-intensive fossil fuel, it does emit greenhouse gases in combustion and potentially in production and distribution. In broad terms, we find that, given the large amounts of natural gas available in the U.S. at moderate cost (enabled to a large degree by the shale gas resource), natural gas can indeed play an important role over the next couple of decades (together with demand management) in economically advancing a clean energy system. However, with increasingly stringent carbon dioxide emissions reductions, natural gas would eventually become too carbon intensive, which highlights the importance of a robust innovation program for zero-carbon options.
We all recognize that today there is controversy about natural gas and its availability and affordability and about environmental impacts from its production and distribution. Our study addresses these issues and I hope that our analysis will inform your judgments and policy choices about the role natural gas will play in our nation’s energy future.
Global Gas Resources – Scale and Cost
Global natural gas resources are abundant. Recent analysis carried out as part of the MIT Future of Natural Gas Study1 established a mean estimate of 16,200 Tcf2 for the remaining global resource base, with a range between 12,400 Tcf (with a 90% probability of being exceeded) and 20,800 Tcf (with a 10% probability of being exceeded). To put these estimates into context, 2009 global gas consumption amounted to 109 Tcf. These estimates do not include any unconventional resources outside of the United States and Canada, because of the large uncertainty. However, a recent EIA study has estimated a further 5,300 Tcf of shale gas internationally, just in regions that do not have large conventional resources.
Although the global gas resource base is large, it is geographically concentrated. Excluding the recent estimates of global shale resources, around which very high levels of uncertainty still exist, about 70% of all gas resources are located in only three regions: Russia, the Middle East (primarily Qatar and Iran) and North America. By some measures, this makes global gas resources even more geographically concentrated than oil. It also means that political considerations and individual country depletion policies play at least as big a role in global gas resource development as geology and economics.
Figure 1 depicts global natural gas supply curves calculated estimated by the MIT study group. These curves quantify the price required at the point of export to enable the economic development of a given volume of gas3. Studying the figure indicates that much of the global gas resource can be developed at relatively low prices at the point of export. For example the figure shows that globally, over 4,000 Tcf of gas can be developed at or below $2.00/MMBtu, with 9,000 Tcf available at or below $4.00/MMBtu. These certainly are very large volumes of low-cost gas. However, a very large portion of this gas is geographically isolated from the major gas consuming markets in Europe, East Asia and North America. Unlike oil, the cost of transporting gas over long distances is high. Getting the gas to market requires either long-haul pipelines or liquefied natural gas (LNG) infrastructure. This means that gas, which can be economically developed at the export point for $1.00-2.00/MMBtu may well require an added $3.00-5.00/MMBtu of transport costs to get the gas to its ultimate destination. These high transportation costs are also a significant factor in the evolution of the global gas market.
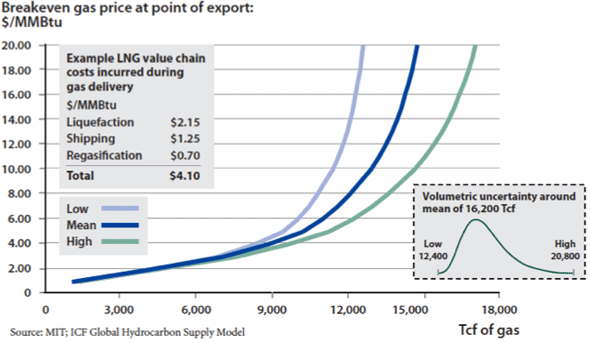
Figure 1: Global gas supply cost curve, with uncertainty; 2007 cost base. – Source: MIT Future of Natural Gas study
Global Gas Production – Recent Trends
Over the past two decades global production of natural gas has grown significantly, rising by almost 42% overall from approximately 74 Tcf in 1990 to 105 Tcf in 2009. This is almost twice the growth rate of global oil production during the same period. Much of this growth has been driven by the rapid expansion of production in areas that were not major producers prior to 1990. This trend is illustrated in Figure 2, which shows how production growth in regions such as the Middle East, Africa, and Asia & Oceania has significantly outpaced growth in the traditional producing regions of North America, and Eurasia (primarily Russia).
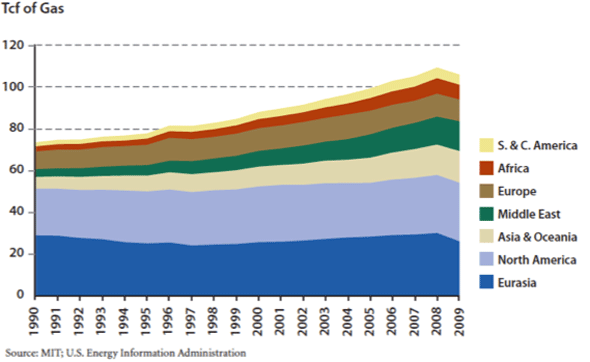
Figure 2: Trends in Annual Global Dry Gas Production by Region between 1990 and 2009.
Figure 3 compares the 1990 and 2009 annual production levels for the ten largest gas- producing nations (as defined by 2009 output). In addition to demonstrating the dominance of the United States and Russia compared to other producing countries, this figure illustrates the very significant growth rates in other countries.
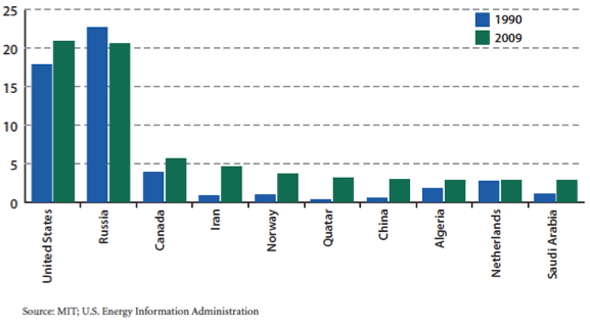
Figure 3: Comparison of 1990 and 2009 Natural Gas Production Levels for the Top 10 Natural Gas Producing Nations (as defined by 2009 output)
The substantial growth in production from 1990 to 2009 is leading to the expansion of gas markets and the rise in global cross-border gas trade. From 1993 to 2008, global cross-border gas trade almost doubled, growing from 18 Tcf (25% of global supply), to 35 Tcf (32% of global supply). The vast majority of cross-boarder gas movements have historically been via pipeline. However, LNG is playing an increasing role. In 1993, 17% of cross-boarder gas trade was via LNG. By 2008 the proportion had increased to 23%, and the absolute volume had increased by 5 Tcf, or 166%. Due to improving technology and growing global gas demand, LNG is likely to continue to grow in importance.
United States Natural Gas Supply – A New Paradigm
Over the past five years the natural gas supply landscape in the United States has changed greatly – the driving force behind this change has been the rapid growth in production from shale gas plays, as illustrated in Figure 4(a). Reviewing EIA, state and commercial data reveals that the proportion of total U.S. gas production coming from shale resources grew from less than 1% in 2000, to 20% in 2010. By the end of 2011, this is expected to reach 25%. Such growth rates would be remarkable in any context, but in the U.S., the world’s largest gas producing nation, it really does represent a paradigm shift.
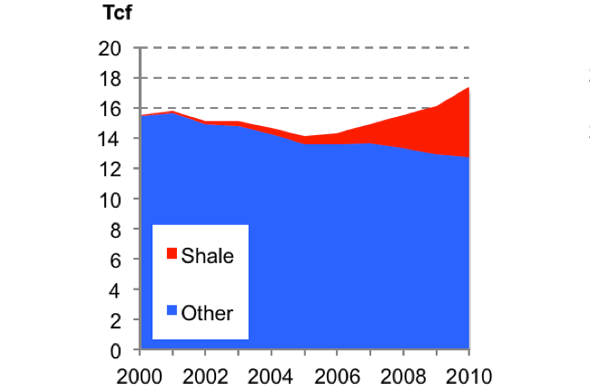
Figure 4(a): Breakdown of annual gross gas production in the L48 United States between 200 and 2010. Source – MIT; HPDI production database.
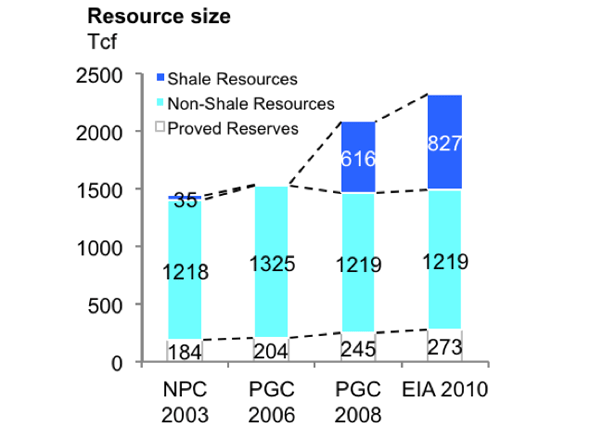
Figure 4(b): Changes in the estimated size of the U.S. gas resource over the past decade.
The emergence of shale gas has also resulted in dramatic increases in the estimated size of the U.S. gas resource base. As shown in Figure 4(b), a 2003 National Petroleum Council (NPC) assessment estimated the U.S. resource base to be 1,437 Tcf, with only 35 Tcf of this being shale. Between 2006 and 2008 the Potential Gas Committee (PGC) increased their estimate of the U.S. resource base by 551 Tcf, and explicitly estimated the size of the shale resource at 616 Tcf. Last year the EIA further upped its estimate of the U.S. shale resource to 827 Tcf – this means shale gas now makes up 36% of all U.S. gas resources.
U.S. Shale Gas Resource – Uncertainty and Relative Economics
The rapidly increasing estimates of the size of the U.S. shale resource have generated significant excitement, both within the gas industry and indeed further afield. However, shale gas production is still a nascent industry – estimates of the size and relative economics of the shale resource are still subject to considerable uncertainty. Supply- side analysis carried out as part of the MIT Future of Natural Gas Study has explored this uncertainty in great detail, both at the resource size and relative economics levels. Some of the key conclusions of this analysis include:
- Shale gas is now a very substantial component of the overall U.S. gas resource base – MIT’s mean estimate of recoverable shale gas volumes is 630 Tcf, or just over 30% of all U.S. gas resources.
- Significant uncertainty exists regarding the size of the shale resource – MIT’s low estimate (90% probability of being exceeded) is 418 Tcf, and its high estimate (10% probability of being exceeded) is 871 Tcf.
- Shale gas is not “cheap gas,” rather it is a large resource of “moderate cost gas,” with a less steep supply curve than other resource types – Of the 900 Tcf of gas recoverable in the U.S. at or below $8.00/MMBtu, 470 Tcf is shale gas.
- There is substantial intra and inter-play variability in the production, and associated economic performance of individual shale wells; however, on a portfolio basis the shale plays are high performance.
- The fact that many shale plays also produce natural gas liquids, whose price is linked with the oil price means that the economics of shale can be substantially better than they would appear if only gas production is considered.
The impact of shale gas on the scale and relative economics of the U.S. gas resource base is shown in Figure 5(a) & (b). Figure 5(a), illustrates the mean, high and low U.S. natural gas supply curves calculated for the MIT Future of Natural Gas Study. Figure 5(b) disaggregates the mean supply curve from Figure 5(a) by gas type. Reviewing Figure 5(b) reveals that relatively small volumes of gas are available at or below $4.00/MMBtu. This reflects the maturity of the U.S. resource base, which has seen much of its “easy” gas produced over the past decades. However, of the gas available in the moderate price range; $4.00-8.00/MMBtu, over 60% is shale. For the coming two decades MIT analysis predicts U.S. gas prices in the $6.00-8.00/MMBtu range. At these price levels Figure 5(b) illustrates that shale gas will in most instances be the lowest cost resource. An important point to keep in mind when considering gas prices is the fact that 2011 U.S. prices have been very low, due in all likelihood to a combination of macro-economics factors, and an oversupply of gas from prolific shales, where operators continue to drill in the short-term in order to hold lease positions. In the recent past U.S. prices have been substantially higher than $10.00/MMBtu, and in this context the shale resource appears very attractive.
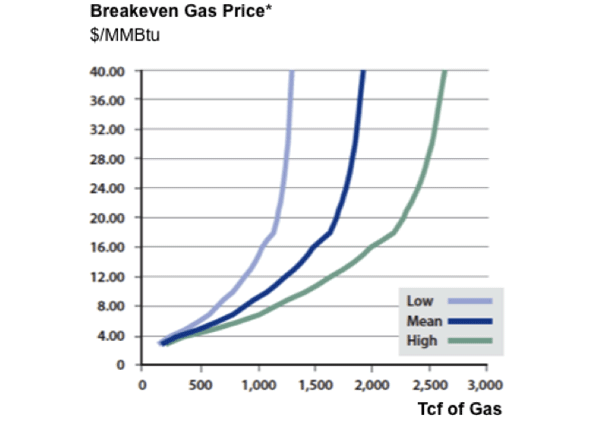
Figure 5(a): U.S. natural gas supply curves calculated using mean, high and low resource estimates – Source: MIT Future of Natural Gas study
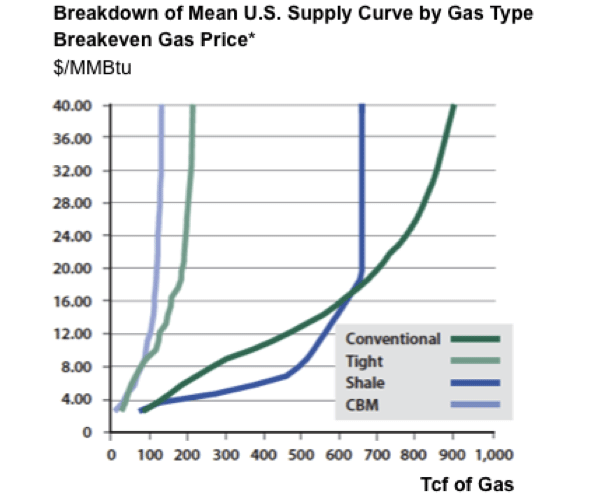
Figure 5(b): Disaggregation of the mean U.S. natural gas supply curve by gas resource type – Source: MIT Future of Natural Gas study
An important and somewhat controversial feature of the shale resource is inter and intra-play per-well performance variability. An illustration of this variability is shown in Figure 6(a), which plots the probability distribution of the initial production rates (IP) (a key performance metric of shale wells) of the wells drilled in Texas’ Barnett Shale play during 2009. This distribution is made up of over 1,600 individual wells. Reviewing the data reveals there is a 3X variation between the IP rate of a good (P20), and bad (P80) well. Such a wide range would be uncommon with conventional gas; however, similar variability is observed in all the major shale plays currently in production. Naturally, this variability impacts on the economics of shale wells. Figure 6(b) shows a table that illustrates how the performance variation of shale wells drilled during 2009 in the five major gas shale plays translated into per-well breakeven gas prices (BEPs).
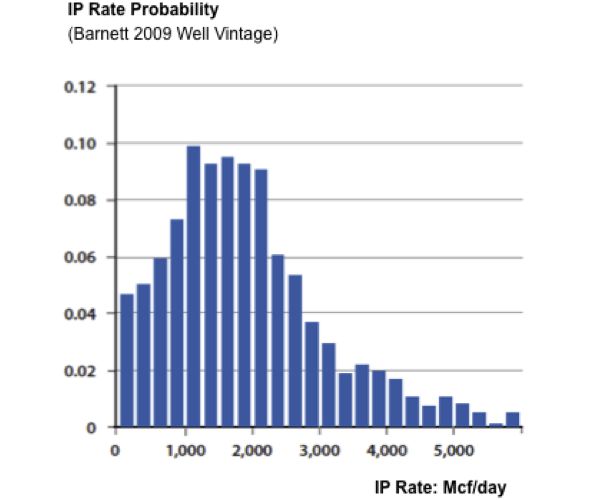
Figure 6(a): Probability distribution of IP rates for 2009 vintage Barnett Shale wells. Source: MIT Future of Natural Gas study.
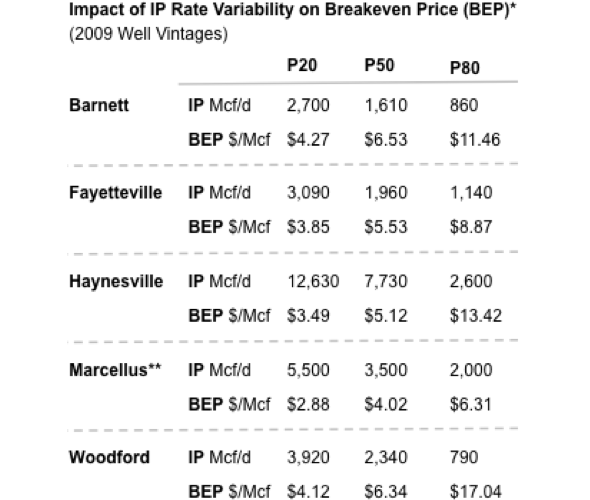
Figure 6(b): 2009 breakeven gas price calculations for five of the major U.S shale plays. Source: MIT Future of Natural Gas study.
For the plays shown in Figure 6(b), the BEPs for P50 wells, i.e. median performance wells, range between $4.00 and $6.50/MMBtu. However, many of the wells in each play had much higher and lower BEPs due to the wide production performance variation. This means shale gas producers are not currently drilling only low-cost shale resource; rather their drilling is sampling along the entire supply curve. Clearly this is not ideal, as operators would rather only develop the lowest-cost resources; however, as long as their overall portfolio BEP is acceptable, the variability in individual well performance is of little concern. That is not to suggest that operators are not interested in reducing this variability. Significant work is ongoing to reduce the per-well performance variability through the use of better technology.
Along with gas production variability, the economics of shale can be significantly influenced by the co-production of natural gas liquids (NGLs), whose price is linked to the international price for oil. Some shale areas are termed “wet,” meaning that wells in those areas produce NGLs along with gas, and depending on the ratio of liquid to gas production, the L/G ratio, the BEPs of shale wells in such areas are often dramatically lower than they would be if the wells only produced gas. A demonstration of how significant an impact NGLs can have on shale well economics is shown in Figure 7. Here, the BEP calculated for a theoretical well assuming a 2009 Marcellus P50 gas production rate is plotted as the L/G ratio is varied from 0 to 50.
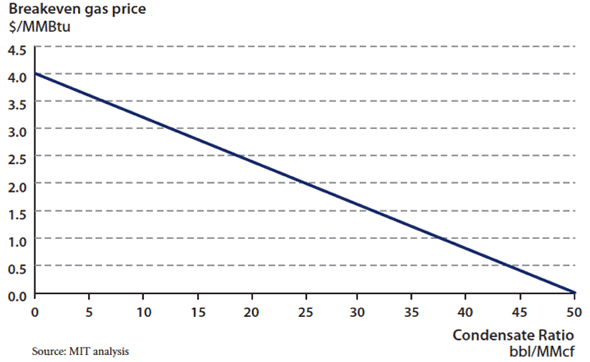
Figure 7: Plot of how the BEP of a shale gas well varies with the L/G ratio, assuming 2009 Marcellus P50 gas production rate and an $80/bbl NGL price.
In this theoretical example, the BEP drops from $4.00/MMBtu, to $0.00/MMBtu as the L/G ratio rises from 0 (a “dry” well) to 50 (a very wet well). With appreciable NGLs production, the gas effectively becomes free. Several of the major shale plays currently in development contain zones which are “wet,” including the southwest portion of the Marcellus shale in Pennsylvania and the Eagle Ford shale in southwest Texas. In these areas, shale wells which may not appear economic at first glance based on the cost of drilling and the price of gas alone, are in fact likely to be making money due to the favorable oil-gas price spread.
Shale Gas Development – Environmental Concerns and Impacts
The growth in shale gas production has not been without controversy. The use of hydraulic fracturing (or fracking as it is referred to in the oil field vernacular), a necessary step in shale gas extraction, has been a particular focus of scrutiny by groups concerned about the environmental impacts of shale gas production. The MIT Future of Natural Gas Studyexamined the environmental issues around shale gas production and identified a set of primary environmental risks, which arise from shale development. They are:
- Contamination of groundwater aquifers with drilling fluids or natural gas while drilling and setting casing through the shallow freshwater zones;
- On-site surface spills of drilling fluids, fracture fluids and wastewater from fracture flowbacks;
- Contamination as a result of inappropriate off-site wastewater disposal;
- Excessive water withdrawals for use in high volume fracturing; and
- Excessive road traffic and impact on air quality.
In considering these risks, the MIT analysis concluded that they are “challenging but manageable.” In all instances the risks can be mitigated to acceptable levels through appropriate regulation and oversight. In particular, the risk of groundwater contamination via gas migration or from drilling fluid can be effectively dealt with if best practice case setting and cementing protocols are rigorously enforced. Regulation of shale (and other oil and gas) activity is generally controlled at the state level, meaning that acceptable practices can vary between shale plays. The MIT study recommends that in order to minimize environmental impacts, current best practice regulation and oversight should be applied uniformly to all shales. It is also the case that shale gas production can result in a large industrial activity. The local communities clearly have a strong role in evaluating the tradeoffs of significant economic activity and industrial activity.
On the specific concerns that surround the chemicals being used in fracture fluids, The MIT study recommends requiring complete public disclosure of all fracture fluid components. Furthermore the study recommends that efforts to eliminate the need for toxic components in fracture fluid be continued. The study also recommends required integrated regional surface water management plans.
Another concern has been that of methane emission during natural gas production, delivery and use. These factors have been included in the modeling described in the next section. Nevertheless, we recommend that the DOE and EPA should co-lead a new effort to review, and update as appropriate, the methane emission factors associated with fossil fuel production, transportation, storage, distribution, and end-use. This has public policy implications. The review and analysis should rely on data to the extent possible.
The Role of Natural Gas in a Carbon-Constrained World
To examine and analyze the role of natural gas in a carbon-constrained world, we utilized MIT’s EPPA model, a global model which has been used and refined over twenty years to examine the complicated interplay of economics, a range of energy technologies, and trade flows for 16 regions in the world, including the US. The model accounts for all Kyoto gases. The study’s supply/cost curves, discussed above, were inputs to the economic modeling work and the results, while based on global analysis, are focused on the US. I also stress that the results are not “predictions” but are instead scenarios based on assumptions and economically driven behavior.
We focus today on the CO2 price scenario in the study which assumes the following: a 50% reduction from 2005 to 2050 in CO2 emissions by developed nations, with no offsets; a 50% reduction in CO2 emissions by large emerging economies by 2070; and no emissions reductions from least developed nations.
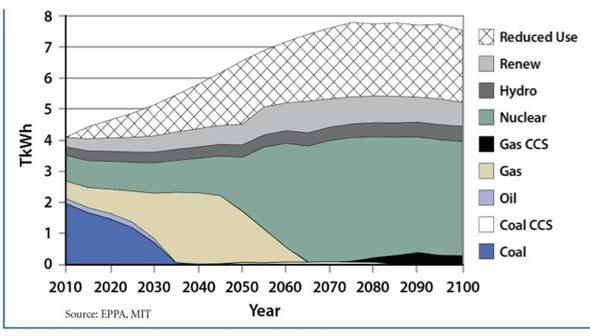
Figure 8: Energy Mix in Electric Generation under a Price-based Climate Policy, Mean Natural Gas Resources and Regional Natural Gas Markets.
There are several key takeaways from this analysis, two of which are clearly seen in Figure 8. This graph is a result of EPPA runs and depicts the US power sector only under the scenario described above, carried out to 2100. In this graph, which reflects a model driven by ruthless economics in the face of the stringent CO2 limit, we find:
- there must be significant demand reduction from business-as-usual to meet the emissions reduction targets;
- natural gas consumption increases dramatically. This occurs because of the lower carbon characteristics of natural gas;
- there is total displacement of coal generation largely with natural gas generation by around 2035;
- carbon capture and sequestration (CCS) is too expensive to make inroads for many decades; and
- by around 2045, natural gas itself becomes too carbon intensive to meet the carbon limits and consumption starts to decline. The slack in this pre-Fukushima model run is taken up largely by nuclear but this could be any scalable no-carbon generation fuel; the point is decarbonization of the power sector after mid-century.
This figure has become known in our group as the “bridge fuel” slide. It graphically illustrates the essential role natural gas plays between now and 2050 in a carbon constrained world by substituting for coal generation in the power sector. It also makes the point that the bridge must have a suitable landing point. We must continue to invest in research in carbon-free sources – renewables, nuclear, and CCS for both coal and natural gas.
The global market structure is important for the results because of trade between different regions. Currently there is no global market in gas that approximates the oil market. Instead, we have three distinct regional markets where gas prices are established in different ways and trade between the three is relatively restricted. We used the model to explore a scenario in which the regional barriers to trade are lifted, leading to a truly global market in gas (of course with transportation costs included). The results are seen in Figures 9a and 9b.
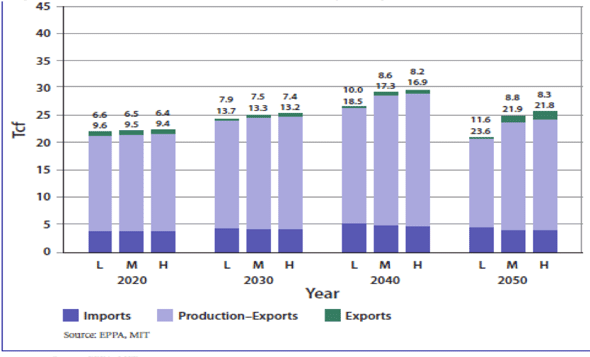
Figure 9a. U.S. Gas Use, Production, Imports & Exports for Low, Mean, High US Resources, Price Based Policy, Regional Markets ($1000 cf)
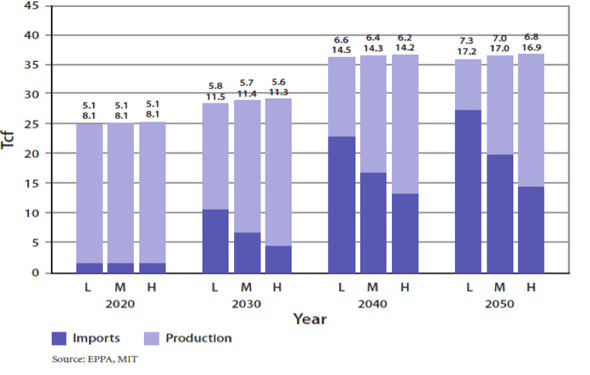
Figure 9b. U.S. Gas Use, Production, Imports & Exports for Low, Mean, High US Resources, Price Based Policy, Global Markets ($1000 cf)
Interestingly, in spite of the substantial domestic gas supply in the US, by 2030 we see an increase in gas imports to the US. This occurs because, as I have noted, there are abundant supplies of very low-cost gas in the world, and the LNG transportation costs can be overcome for some gas.
This may understandably raise concerns about energy security and reliance on imports. This scenario demonstrates however that there are major benefits to US gas consumers as prices for gas are substantially lower (almost 25%) in the global market scenario. Also, domestic gas production does not decline in the US for quite some time despite the imports. This is because the lower gas prices in the global market scenario increase demand and imports largely make up the increased demand.
Fuel Substitution Options
The U.S. natural gas supply situation has created new opportunities for expanding natural gas use, enhancing the substitution possibilities for natural gas in the electricity, industry, buildings, and transportation sectors. I will specifically discuss the substitution of gas for:
- coal in the power generation sector;
- coal in the industrial sector, specifically for industrial boilers;
- electricity in buildings; and
- oil in transportation.
I will also briefly highlight the impacts on natural gas of large scale penetration of intermittent renewables in the power sector.
Natural Gas Substitution for Coal in the Power Sector
As noted in the EPPA discussion above, under a carbon-price scenario natural gas displaces coal in the power sector by around 2035. In the gas study, we drilled down in this area to try to understand how this substitution might occur and what some of the impacts might be. More specifically, we examined opportunities created by the current surplus of natural gas combined cycle generation capacity and what the impacts of utilizing this “surplus” capacity might be on carbon emissions.
The US has more installed nameplate natural gas generation capacity than coal (see Figure 10) but gas supplies only 23% of our generation compared to 44% from coal; this demonstrates that there is significant unused gas capacity. NGCC generation units in the U.S. averaged only 42% capacity factors in 2009 (Table 1) although they are capable of operating at capacity factors of around 85%. NGCC units are highly efficient, relatively inexpensive to build, and produce significantly fewer CO2 and other pollutant emissions than coal plants.
| Coal | Petroleum | Natural Gas CC | Natural Gas Other | Nuclear | Hydroelectric Conventional | Other Renewables | All Energy Sources |
| 64 | 8 | 42 | 10 | 90 | 40 | 34 | 45 |
Table 1. 2009 Average Capacity Factors by Select Energy Source, U.S. (numbers rounded)
Natural gas plants however typically have the highest marginal cost (although this is changing) and tends to get dispatched after other fuel sources for power generation. This is because the marginal cost is dominated by fuel cost. We analyzed what the carbon impacts might be if we changed this order and dispatched surplus NGCC generation ahead of coal. Older inefficient coal units are good candidates for substitution by NGCC.
After isolating how much of this NGCC generation capacity is actually surplus – defined as the amount of NGCC generation that can be used over the course of one year to replace coal while respecting transmission limits, operation constraints and demand levels at any given time – through modeling we were able to conclude the following about a policy that requires the dispatch of surplus NGCC over coal generation:
- nationwide, CO2 emissions from power generation would be reduced by 20%
- the cost of CO2 emissions avoidance would be around $16 per ton
- mercury emissions would be reduced by 33%
- NOX emissions would be reduce by 32%
- this would require an incremental 4 tcf of natural gas
| Base Case | MISO | ERCOT | PJM | FRCC | ISO-NE |
| CO2 (million metric tons) | 543 | 153 | 446 | 67.2 | 19 |
| Hg (tons) | 13.4 | 2.77 | 11 | 1.32 | 0.138 |
| Case 2 – 20% CO2 Reduction | |||||
| CO2 (million metric tons) | 394 | 121 | 351 | 78.9 | 25.4 |
| Hg (tons) | 9.30 | 1.43 | 7.58 | 1.13 | 0.10 |
| % Hg reduction | 31% | 48% | 31% | 14% | 27% |
Table 2. Emissions of Select Regions Before and After Re-Dispatch, 2012
It should be noted that these impacts vary widely by region of the country, depending on the generation mix, the level of electricity imports/exports, etc (Table 2). Also, the mercury rule in development at EPA may be a significant driver for utilizing surplus NGCC capacity when weighted against the option of retro-fitting coal plants to capture mercury. Finally we note that this option may be the only practical near-term option for large scale CO2 emissions reductions from the power sector. Policy makers could pursue this pathway for near term large-scale reductions in CO2 and other pollutant emissions from the power sector.
Natural Gas Substitution for Coal in the Industrial Sector
Industrial consumers represent about 35% of US gas demand. Currently, 85% of industrial demand is in the manufacturing sector and 36% of manufacturing demand is for industrial boilers. Natural gas industrial boilers have a range of efficiencies: pre-1985 gas boilers average 65-70%; those designed to meet the 2004 standard of 77-82%; and new super boilers with efficiencies in the 94-95% range.
We focus today on large industrial boilers because of standards being developed at EPA for mercury, metals, and other hazardous emissions from industrial coal fired boilers. These National Emissions Standards for Hazardous Air Pollutants (NESHAP), issued then withdrawn by Administrator Jackson for additional comments, are based on Maximum Achievable Control Technologies (MACT). Around 68% of large industrial boilers are coal-fired. Natural gas boilers, which are much cleaner, were not covered by the proposed boiler standards, although there are cost-effective options for greater efficiency. Gas boilers were also excluded from the MACT as a remedy for covered emissions from coal plants.
The EPA economic analysis supporting the new MACT standards assumed that the three sub-categories of coal boilers would retrofit with post-combustion technologies but concluded that gas fuel was too expensive for fuel switching to be considered as an option for meeting MACT standards. The price of gas assumed in the EPA analysis was $9.58 per MMBtu in 2008; today’s price is less than half that.
Using EPA’s methodology but substituting current gas price suggests that EPA may wish to reconsider fuel-switching as an option for meeting MACT standards. The efficiency of natural gas super boilers combined with today’s gas prices shows that the net present value cost for these super boilers is slightly lower than that for retrofitting existing coal boilers (Figure 11). Substitution of large industrial coal boilers with natural gas super-boilers would consume slightly less than one Tcf of incremental gas per year and reduce CO2 emissions by 52,000 to 57,000 tons per year per boiler. Interestingly, because the savings are so significant, there is a negative per ton CO2 emission avoidance price of $5.00. The study concluded that replacing coal boilers with super-efficient gas boilers could be a cost-effective alternative for complying with MACT standards.
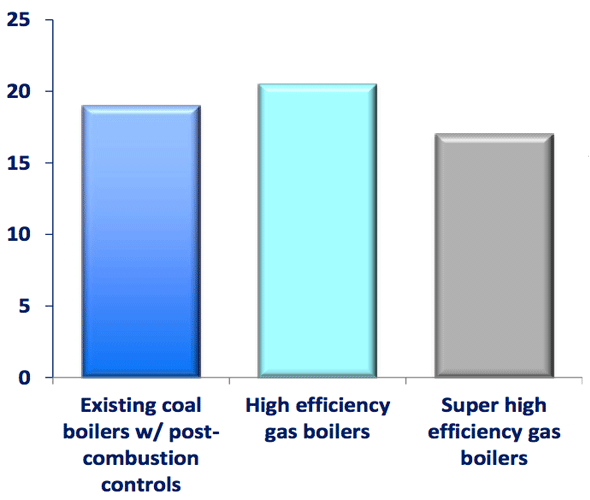
Figure 11. Net Present Value Industrial Boiler Replacement Costs (million $)
Gas Substitution for Electricity in the Buildings Sector
As we saw in the EPPA scenarios, reduced energy consumption is a critical component of a strategy for achieving a low carbon future. Because they represent around 40% of total energy consumed in the US, buildings, both residential and commercial, are an essential focus for reducing energy demand. This is even more critical for natural gas, where buildings represent 55% of all gas consumed, including gas fired electricity for buildings.
The study focused on a comparison of the relative efficiencies of the direct use of fuels in building thermal end uses, especially space conditioning and hot water heating. It specifically examined site efficiency of these appliances (the ratio of useful energy provided divided by the amount of retail energy consumed, either electricity or fuel) compared to full fuel cycle or “source “ efficiency (accounting for all energy used to extract, refine, convert and transport the fuel as well as the efficiency of the end use appliance).
DOE has historically set standards based only on site efficiency. In 2009, the National Research Council recommended that DOE move to source efficiency standards. The analysis in the study validates the NRC recommendation. Figure 12 shows the amount of energy consumed by various furnaces when one looks only at site energy and when one looks at both site and source energy. Using this number in a site calculation, a gas furnace consumes 10% more energy than an electric furnace. When source energy is considered, an electric furnace consumes 194% more energy than a gas furnace. There are corresponding reductions in CO2 emissions.
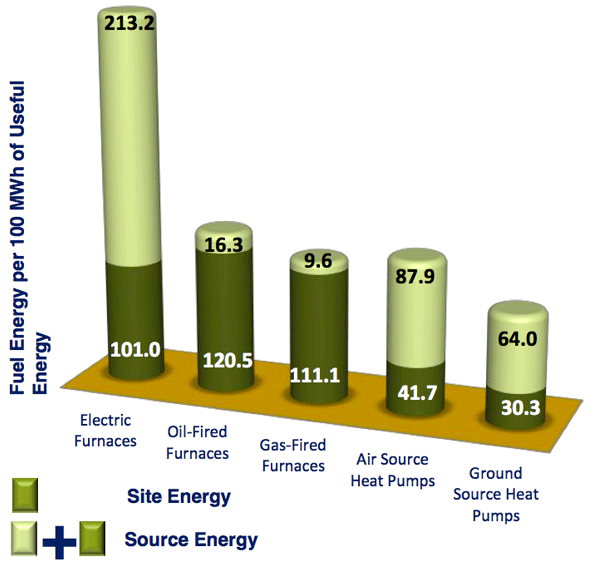
Figure 12. Site vs. Source Energy Consumption of Furnaces
Gas Substitution for Oil based Transportation Fuels
The study examines options for both direct use of natural gas for transportation as well as conversion of natural gas to liquid fuels.
- Compressed Natural Gas (CNG). Globally, there are 11 million natural gas vehicles on the road, 99.9% of which are CNG vehicles. CNG is cheaper than gasoline on an energy equivalency basis but there are upfront vehicle costs that have inhibited the growth of the CNG vehicle markets. For a variety of reasons, some of which are not entirely clear, these costs – for both after-market conversion and factory produced issues — are much higher in the US than elsewhere in the world. The incremental cost for factory produced vehicles in the US for example is $7,000 compared to $3,700 in Europe. The incremental cost of after-market conversions in the US is $10,000, in Singapore it is $2,500.
The study analyzes the payback period for light duty vehicles assuming a $3k and a $10K incremental cost for 12000 miles and 35000 driven per year per year. At the lower conversion cost, vehicles with high miles traveled (typically fleets) have a short payback period, making this an attractive option for taxis for example. This is however illustrative; as noted incremental costs in the US are much higher than $3,000.
These data suggest that CNG offers a significant opportunity in U.S. heavy-duty vehicles used for short-range operation (buses, garbage trucks, delivery trucks), where payback times are around three years or less and infrastructure issues do not impede development. However, for light passenger vehicles, even at 2010 oil-natural gas price differentials, high incremental costs of CNG vehicles lead to long payback times for the average driver, so significant penetration of CNG into the passenger fleet is unlikely in the short term. Payback periods could be reduced significantly if the cost of conversion from gasoline to CNG could be reduced to the levels experienced in other parts of the world such as Europe. The study recommends that the US should consider revising its policies on CNG vehicles, including how aftermarket conversions are certified to reduce up-front costs and facilitate bi-fueled CNG-gasoline capability.
A CO2 emissions charge also favors CNG vehicles relative to gasoline-fueled vehicles. In the carbon-constrained scenario discussed above, the economic scenario has substantial penetration of CHG vehicles towards mid-century. - Liquefied Natural Gas (LNG). LNG has been considered as a transport fuel, particularly in the long-haul trucking sector. However, as a result of operational and infrastructure considerations as well as high incremental costs and an adverse impact on resale value, LNG does not appear to be an attractive option for general use. There may be an opportunity for LNG in the rapidly expanding segment of hub-to-hub trucking operations, where infrastructure and operational challenges can be overcome.
- Conversion of Gas to Liquid Fuels. The chemical conversion of natural gas to liquid fuels could provide an attractive alternative to CNG. Several pathways are possible, with different options yielding different outcomes in terms of total system CO2 emissions and cost. Conversion of natural gas to diesel and gasoline for example – both drop-in fuels that can be used in existing infrastructure, a major plus — require more processing than other options.
The study looks more closely at the methanol liquid fuel option, largely because there is currently large scale industrial production of methanol and it is an alcohol like ethanol, with which we also have a good deal of experience. Methanol production and use has GHG emissions comparable to those of petroleum derived fuels and at today’s oil and gas prices is significantly less expensive than gasoline on an energy basis. As seen in Table 3, at $4 natural gas, methanol is a dollar cheaper than gasoline on a gge basis. This analysis was done when gasoline was $2.30 (excluding taxes); the spread would be significantly greater at today’s gasoline prices.
Methanol requires modest changes to engines because of its corrosive nature and an appropriate distribution infrastructure would be required. The issues are very similar to those for ethanol which has already penetrated the gasoline market at a material level. Introducing methanol, in addition to ethanol, has the energy security benefit of providing fuel options derived from petroleum, biomass, and natural gas feedstocks. To gain security benefits, arbitrage among the fuels is needed at the consumer level, which means flex-fuel vehicles would be required. This arbitrage would place downward pressure on prices, helping to reduce price spikes and volatility.
The study group supports implementation of the open fuel standard. In addition to its recommendation of support for flex fuel vehicles, the study recommends that the federal government conduct a serious comparative study of natural gas derived transportation fuels compared to petroleum and biofuels.
Natural Gas Power Generation and Intermittent Renewables
Natural gas-fired power generation provides the major source of backup to intermittent renewable supplies in most U.S. markets. If policy support continues to increase the supply of intermittent power, then, in the absence of affordable utility-scale storage options, additional natural gas capacitywill be needed to provide system reliability. In most markets, existing regulation does not provide the appropriate incentives to build incremental capacity with low load factors, and regulatory changes may be required.
In the short term — defined here to mean a circumstance where a rapid increase in renewable generation occurs without any adjustment to the rest of the system including generation technologies — increased renewable power displaces natural gas combined cycle generation, reducing demand for natural gas in the power sector. Modeling of the ERCOT system (Texas) provides a more detailed understanding of the generation impacts of doubling wind generation in the short term. These include:
- Wind generation primarily displaces generation from natural gas combined cycle turbines
- Coal plants are forced to cycle
- Natural gas peaking plants are used more
In the longer term, where the overall system has time to adjust through plant retirements and new construction, increased renewables displaces baseload generation. This could mean displacement of coal, nuclear or NGCC generation, depending on the region and policy scenario under consideration. For example, in the 50% CO2 reduction scenario described earlier, increased renewable penetration as a result of cost reductions in renewable generation or government policy such as a renewable portfolio standard, reduces natural gas generation on a nearly one-for-one basis. Another effect: absent breakthroughs in storage technologies, gas peaking units will be needed to manage intermittency. These units however will not be utilized very often — not necessarily an attractive investment option or easily accommodated in existing regulatory and rate structures. As such, the study found that policy and regulatory measures should be developed to facilitate adequate levels of investment in gas generation capacity to ensure system reliability and efficiency.
The study notes a growing interdependency between natural gas and electricity infrastructures, not just to accommodate intermittent renewable penetration but also in a scenario where gas generation displaces coal generation. The degree to which this interdependency stresses both the gas and power infrastructures and creates conditions where the infrastructures and related contracting, legal and regulatory structures may be inadequate is not fully understood. The study recommends that a detailed analysis be conducted of these interdependencies. The current models are inadequate to fully understand the implications of these changing relationships.
Natural Gas Research and Development
- There are numerous RD&D opportunities to address key objectives for natural gas supply, deliver, and use:
- improve the long term economics of resource development as an important contributor to the public good;
- reduce the environmental footprint of natural gas production, delivery and end-use;
- expand current use and create alternative applications for societal objectives, such asemissions reduction and diminished oil dependence;
- improve safety and operation of natural gas infrastructure; and
- improve the efficiency of natural gas conversion and end-use so as to use the resource most effectively.
Given the importance of natural gas in a carbon-constrained world, and these opportunities for improved utilization of the resource, an increase is in order in the level of public and public- private RD&D funding. Historically, public-private RD&D funding played an important role in the development of the unconventional natural gas resource. Indeed, the technologies needed to produce such resources have been pioneered in the United States and now account for about half of domestic production.
Figure 13 shows how the interplay of early stage DOE- supported reservoir characterization, the public- private Gas Research Institute (GRI) funding for technology development and demonstration, and a time-limited tax credit led to robust coalbed methane production. A Royalty Trust Fund (RTF) established in the 2005 Energy Policy Act, and implemented through a public-private partnership, is providing modest resources for unconventional gas technology, specifically including minimization of environmental impacts. However, the elimination of the GRI rate-payer funded program was not compensated by increased DOE appropriations or the RTF. The total public and public-private RD&D funding for natural gas research is down substantially from its peak and in addition is much more limited in scope.
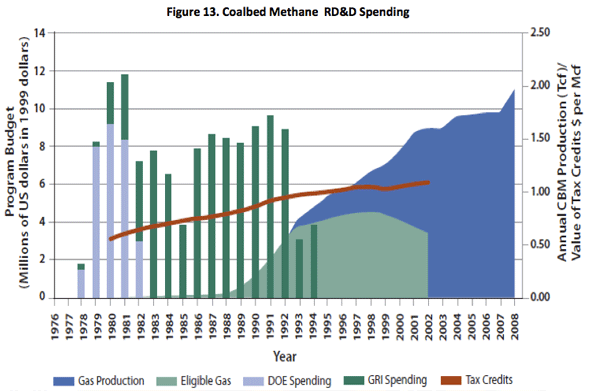
Figure 13. Coalbed Methane RD&D Spending
In agreement with a recommendation made by the President’s Council of Advisors in Science and Technology with respect to the overall Federal energy RD&D effort, we recommend that the Administration and Congress support a broad natural gas RD&D program both through a renewed DOE effort, weighted towards basic research, and a complementary industry-led public-private program, weighted towards applied RD&D. The latter should have an assured funding stream tied to energy production, delivery and use (such as the RTF).
Conclusion
Mr. Chairman, Senator Murkowski, members of the committee, let me conclude with a summary of some of the major findings of the study (the complete list can be found in the study):
- Even with uncertainty, there are abundant supplies of natural gas in the world, and many of these supplies can be developed and produced at relatively low cost. In the U.S., despite their relative maturity, natural gas resources continue to grow, and the development of low-cost and abundant unconventional natural gas resources, particularly shale gas, has a material impact on future availability and price.
- Natural gas plays a major role in most sectors of the modern economy is likely to continue to expand under almost all circumstances
- In a carbon-constrained economy, the relative importance of natural gas is likely to increase even further, as it is one of the most cost-effective means by which to maintain energy supplies while reducing CO2 emissions. This is particularly true in the electric power sector, where, in the U.S., natural gas sets the cost benchmark against which other clean power sources must compete to remove the marginal ton of CO2.
- In the U.S., a combination of demand reduction and displacement of coal-fired power by gas-fired generation is the lowest cost way to reduce CO2 emissions by up to 50%. For more stringent CO2 emissions reductions, further de-carbonization of the energy sector will be required; but natural gas provides a cost-effective bridge to such a low-carbon future.
- The current supply outlook for natural gas will contribute to greater competitiveness of U.S. manufacturing, while the use of more efficient technologies could offset increases in demand and provide cost-effective compliance with emerging environmental requirements.
- International gas trade continues to grow in scope and scale, but its economic, security and political significance is not yet adequately recognized as an important focus for U.S. energy concerns.
2 In the US, natural gas volumes are typically measured in Standard Cubic Feet (Scf), where the volume is measured at a temperature of 60°F and a pressure of one atmosphere (14.7 pounds per square inch). 1 trillion cubic feet (Tcf) ≡ 1012 Scf. Outside North America, natural gas volumes are typically measured in cubic meters. 1 cubic meter ≈35.3 cubic feet.
3 Supply curves shown here are based on oil field costs in 2007. There has been considerable oil field cost inflation, and some recent deflation, in the last 10 years. We have estimated cost curves on a 2004 base (the end of a long period of stable costs) and a 2007 base (reasonably comparable to today’s costs, 70% higher than the 2004 level, and continuing to decline).
This article appears in the Autumn 2011 issue of Energy Futures.