Nations worldwide are increasingly embracing solar power as an alternative electricity source for homes, buildings, and even the grid. Since 2008, installed solar capacity in the United States alone has grown 17-fold, from 1.2 to 20 gigawatts (GW), according to the U.S. Department of Energy.
But do costs outweigh the benefits of installing photovoltaic (PV) systems in every building?
MIT spinout Mapdwell is answering that question by mapping solar potential for entire cities and providing a cost-benefit analysis for each rooftop. On Mapdwell’s satellite-map website, people can click on an individual roof to receive information about installation price, energy and financial savings, and environmental impact.
The idea is to “empower businesses and homeowners with information they need to go solar,” according to the Mapdwell website.
So far, Mapdwell has mapped eight cities across the U.S., including New York, San Francisco, and three in Massachusetts — Boston, Cambridge, and Wellfleet — as well as a few cities in Chile. Mapdwell is currently expanding to include all major metropolitan areas in the U.S. by year’s end.
Results from mapped cities indicate that, in general, solar panel installation is a “good investment” for long-term homeowners, says co-founder and technology co-inventor Christoph Reinhart, an associate professor of architecture and head of the MIT Sustainable Design Lab. “In Cambridge, for example, a good roof will get you your money back within seven years,” he says.
Of course, that’s if you have a “good roof,” Reinhart adds, which depends on a number of factors that Mapdwell takes into consideration. North-facing roofs get less sunlight that those facing other directions, especially south. But the main culprits for lowering efficiencies, Reinhart says, are trees and other sources of shading. “In the summer you want trees to lessen your air-conditional loads. But if your roof is heavily shaded, that’s obviously not good for solar,” he says.
Mapdwell also provides city-level statistics on “high yield” potential solar capacity and other metrics, giving municipalities a clearer picture of the costs and savings of promoting solar power. For example, Mapdwell estimates Boston has about 1.5 GW of untapped solar capacity, Washington D.C. has 2 GW, and San Francisco has roughly 3 GW.
New York City, on the other hand, has a whopping 11 GW solar potential. If that capacity were met, the solar panels would offset carbon emissions equivalent to planting 185 million trees, according to Mapdwell.
Details, details
To map cities, Mapdwell collects data from LiDAR-equipped planes — which survey urban topography using reflections from lasers to map the terrain — along with geographical and weather data. Additional analysis provides a detailed 3-D model of every rooftop layout.
Data is fed into Solar System, Mapdwell’s online mapping platform, which was developed at MIT and provides a higher resolution and greater accuracy than other mapping services, Reinhart says.
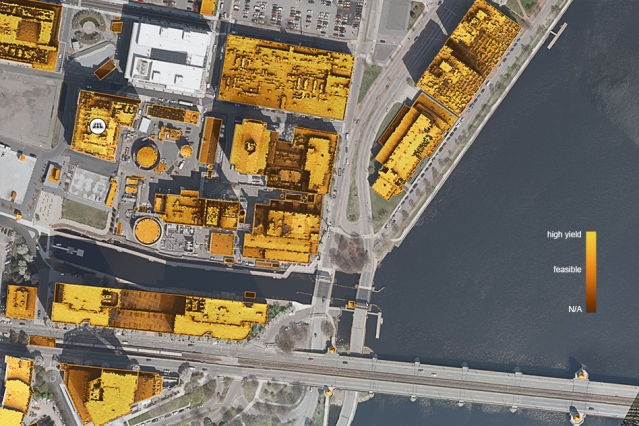
On Mapdwell’s website, each rooftop is covered with many color-coded dots that represent open areas for solar-panel installation. They range in color from bright yellow — representing the highest yields — to orange, to brown, which represents decreasing solar efficiency. Users can outline areas where they may want to install panels, or use a default mode that automatically highlights the most “high-yield” areas. They’ll get specific numbers for the costs of installing a system, the payback time in years, the average monthly and annual revenue, and any tax credits earned. Also displayed are the energy savings equivalent to trees planted, offset carbon, homes powered, and metrics such as energy output, panel efficiency, and more.
“It becomes very specific in telling you where to place the systems and what the local payback times are,” Reinhart says. If interested, users can print or share comprehensive reports and contact installers directly through Solar System’s interface.
Strategy, technology, and design
Reinhart started working on Mapdwell’s core technology in 2011, when he became aware of solar-mapping tools that were cropping up for places such as Boston and New York City. “But when you looked in detail at the maps online, you saw funny things happening,” he says. In other words, the algorithms were working solar radiation calculations that were outdated, inaccurate, or wrong.
At the time, Reinhart’s group had been mapping individual buildings for solar potential. Securing funding from the National Science Foundation, they built out this technology to assess solar potential for entire cities, focusing initially on Cambridge — “to be a good neighbor,” Reinhart says. They presented results to the government, estimating that fitting the city’s 17,000 rooftops with solar panels could generate roughly 30 percent of the city’s electricity.
This Cambridge study opened up Reinhart’s eyes to the commercial potential of displaying solar rooftop data for home and business owners — and the importance of software design. “If we showed people what we were using, no one would get it,” Reinhart says, laughing.
Reinhart partnered with co-founder and current CEO Eduardo Berlin, a former colleague at Harvard University whose research centered around information-driven models for sustainability in the real estate market. Berlin worked on the company’s plan and the platform’s concept and design, including the popular color-coded dots. “You get real dollar amounts, which adds to the value of the system, but people process graphical information better than numbers,” Reinhart says. “That color scheme is incredibly important and seductive.”
Their platform landed them unprecedented results in a 2014 case study for Wellfleet’s Solarize Campaign. Within four months, 10 percent of Wellfleet’s households had commissioned a PV system, “which is seven times higher than comparable solarize program results in other Massachusetts communities at the same time, under identical pricing and framework,” according to Berlin.
Using the platform for initial screening, installers presented quotes for 94 percent of sites visited. More than half of these proposals became contracts. That’s the benefit of having detailed information about photovoltaic installations, Reinhart says: “You come to a site, only to be very sure that the site’s good. Then half the time the owner says yes because they already know from Mapdwell how much it’s going to cost.”
Mapdwell is currently scaling to cover large U.S. metropolitan areas in the next few months. Additionally, Mapdwell has developed tools based on its data to lower customer-acquisition costs for solar-power stakeholders “and ignite a market that is ready and eager for much faster growth,” Berlin says.
Back at MIT, Reinhart and the Sustainable Design Lab are now using similar tools for their newest project: a building-energy model of Boston, which estimates the citywide hourly energy demand loads down to the individual building level. “This is where we want to go forward in cities,” Reinhart says.