In brief
MIT researchers have developed a way to determine which U.S. households win and lose financially under policies designed to reduce carbon emissions. Using census data and machine learning, they estimate average impacts on household budgets of specific policies at fine resolution across the continental United States. Results show that taxing carbon emissions and redistributing the collected revenues—the policy touted as most efficient at bringing about change—protects vulnerable low-income households but ends up squeezing the budgets of those in the middle of the country and in rural areas. The analyses show that slightly adjusting the refunds can correct those unintended consequences. The researchers determined that fuel economy and clean energy standards are policies that would also be inequitable and provide no revenue with which to make corrections. Already, policy makers have requested special MIT analyses to help them better understand the potential impacts of climate policies under discussion.
The growing urgency of today’s climate challenge is intensifying discussions of policy measures that could enable the United States to achieve net-zero carbon emissions by 2050. Leading economists support policies that tax carbon emissions as the approach that will bring the needed change most quickly and at lowest cost. But there are serious questions about the possible inequity of that approach. All policies lead to unintended consequences, including transferring money from one household to another. If a carbon tax is imposed, will certain groups bear more of the burden than others?
The burden imposed will depend—directly or indirectly—on the level of carbon-emitting goods and services that various groups consume. The first step in addressing the equity question is therefore to establish the “carbon footprint” of households across the country. “The ideal would be to know the carbon footprint of every household in the United States, but that’s not feasible,” says Christopher Knittel, the George P. Shultz Professor of Energy Economics at the MIT Sloan School of Management, deputy director for policy at the MIT Energy Initiative, and director of the MIT Center for Energy and Environmental Policy Research.
Instead, Knittel and Tomas Green SM ’20, now a fellow at the U.S. Department of Energy, set their sights on determining the carbon footprint down to the level of a census tract. There are more than 74,000 census tracts in the United States, each including about 4,000 households. The researchers’ goal was to calculate the average carbon footprint of the 4,000 households in each census tract.
No data are available on the consumption of electricity, natural gas, gasoline, or other sources of carbon emissions at the census tract level. “But we do have such data for a representative sample of Americans—along with their age, income, a variety of other demographics, and maybe what state they live in,” says Knittel. “That’s where the machine learning comes in.”
By analyzing those data, a machine learning model that the team developed determines the relationship between the variables about those people and their consumption of, for example, electricity. Once that relationship is known, the model can apply it to data on age, income, and other variables for a given census tract and estimate average electricity consumption. “Then we do that for all the things that produce carbon and add it all up for that census tract,” explains Knittel. “Now we have the average carbon footprint for all households at the census tract level.” Ultimately, Knittel and Green were able to estimate average household carbon footprints for 72,538 of the 74,134 census tracts in the United States.
What the carbon footprints tell us
Knittel finds the carbon footprints striking. “There are three broad lessons that we learn from the carbon footprints,” he says, emphasizing that all three should be taken into account during the policy-making process.
The first broad lesson is that carbon footprints increase with income. In other words, wealthy people produce more carbon.
The second is that carbon footprints are higher in the middle of the continental United States and lower on the West Coast and along the mid to south Atlantic Coast.
The third is that carbon footprints are lower in cities than in rural and suburban areas.
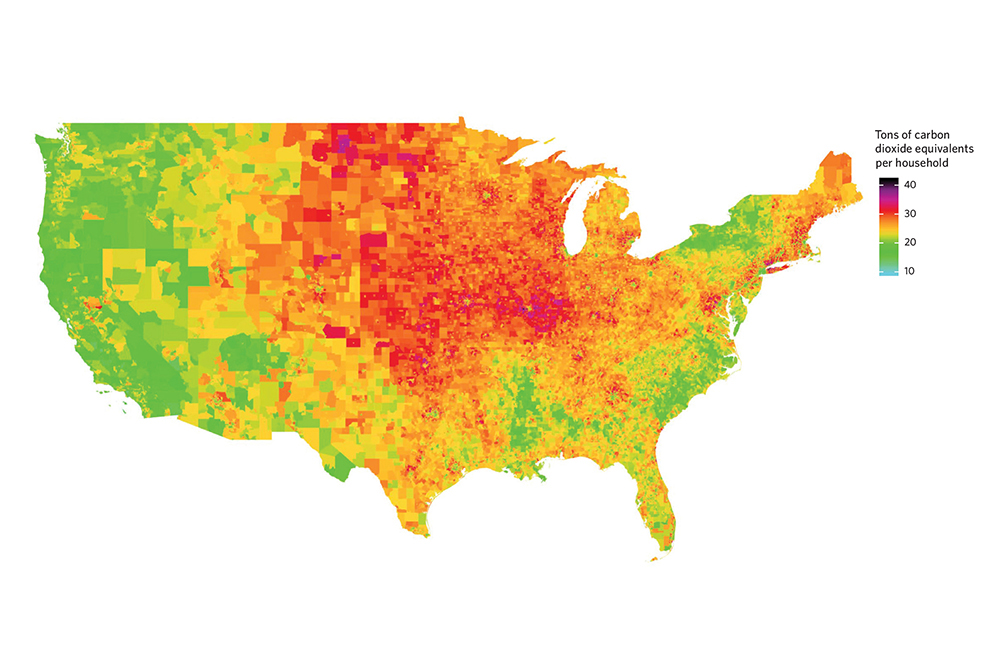
To convey those findings, Knittel and Green use maps with colors that represent average household carbon footprints at the census tract level. For example, the map at the top of the page shows household carbon footprints for the continental United States. The key at the right defines the carbon footprints in terms of tons of carbon dioxide equivalents, a measure that puts emissions of all greenhouse gases on a common scale. The colors provide visual evidence of the second broad lesson. The red in the middle of the country indicates that carbon footprints are high in that region, as they are in certain areas of the Northeast due to cold winters and high consumption of heating oil. The West Coast and lower Atlantic Seaboard are among the areas dominated by green, indicating low carbon footprints.
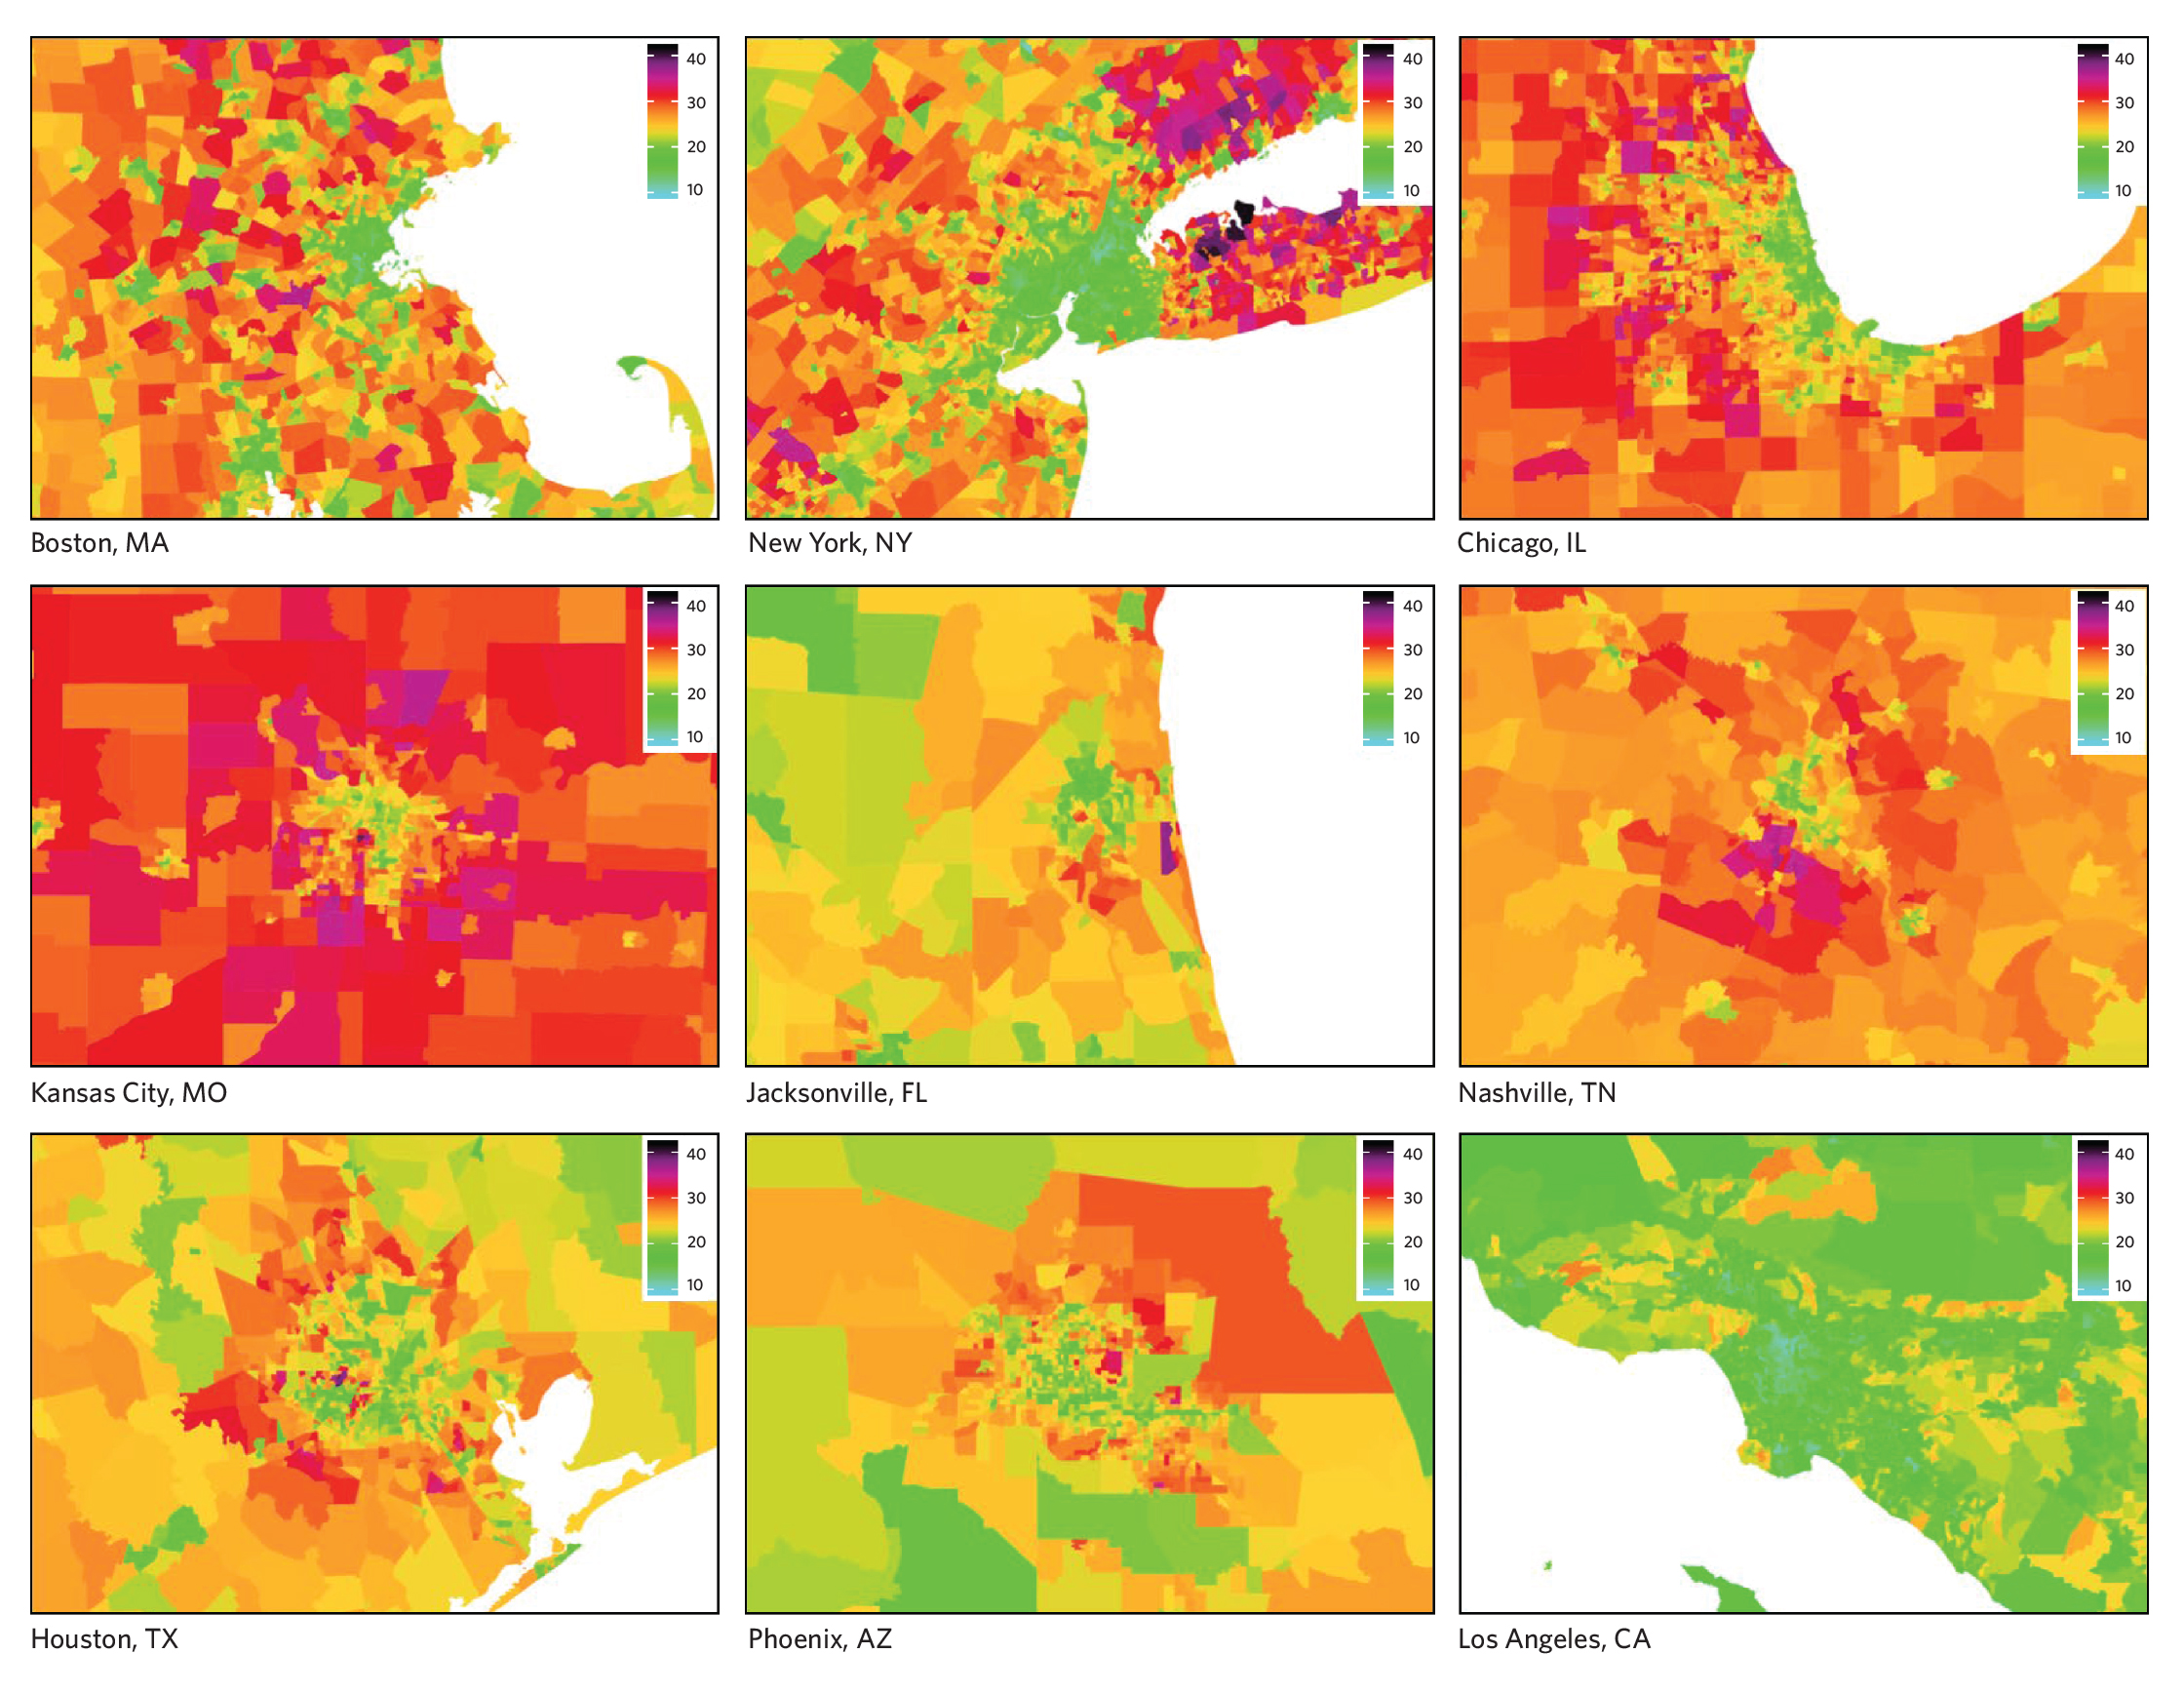
Average household carbon footprints for a sampling of U.S. cities (in tons of carbon dioxide equivalents per household). As shown in the maps above, in many cities—for example, Chicago, Kansas City, and Los Angeles—average household carbon footprints are higher in the suburbs than in the city center. As a result, under a carbon tax policy, suburban dwellers would likely bear more of the burden than residents in the city center.
The maps in the graphic above show carbon footprints in various cities. In most cases, they demonstrate the third broad lesson—that carbon footprints are lower in urban areas than in the suburbs. Chicago and Kansas City are good examples: They are green in the center and become more yellow and then red moving outward. At a glance, Los Angeles looks green; on closer inspection, one can see blue sections in the city center, indicating the very lowest carbon footprints on the scale.
The figure below provides a quantitative look at both the impact of wealth on carbon footprints—the first broad lesson—and how that impact changes depending on how urban or rural an area is—the third broad lesson. The chart divides the total households in the United States into five income groups, or “quintiles,” of equal size—an approach often used in economic analysis. (As an example, if there were 100 households, they could be ordered based on income and then placed into five income quintiles with 20 households in each one.) In the figure, income increases from left to right. The quintiles are further divided into three rows—urban, suburban, and rural, from top to bottom. Each of the 15 plots shows the distribution of household carbon footprints in that group. Carbon footprint is on the x-axis and fraction of households on the y-axis. The vertical dashed lines show the U.S. average household carbon footprint.
Looking across the top row from left to right—which shows urban areas from the lowest to the highest income quintile—the shaded area representing the carbon footprint distribution shifts from left to right. So, as households become wealthier, their carbon footprints increase.
The trend also changes depending on where the household is located. Looking from top to bottom within the same income quintile, the carbon footprint distribution shifts to the right. So, for a given income group, carbon footprints are generally higher for households in suburban areas than in urban areas and still higher for households in rural areas. That change serves to quantify the researchers’ third broad lesson—that people in more rural areas have higher carbon footprints than those in cities.
“We find that any policy supporting decarbonization is likely to be tougher on the middle of the U.S. and tougher on rural and suburban areas,” says Knittel. “That’s not usually a recipe for success in Washington, D.C.”
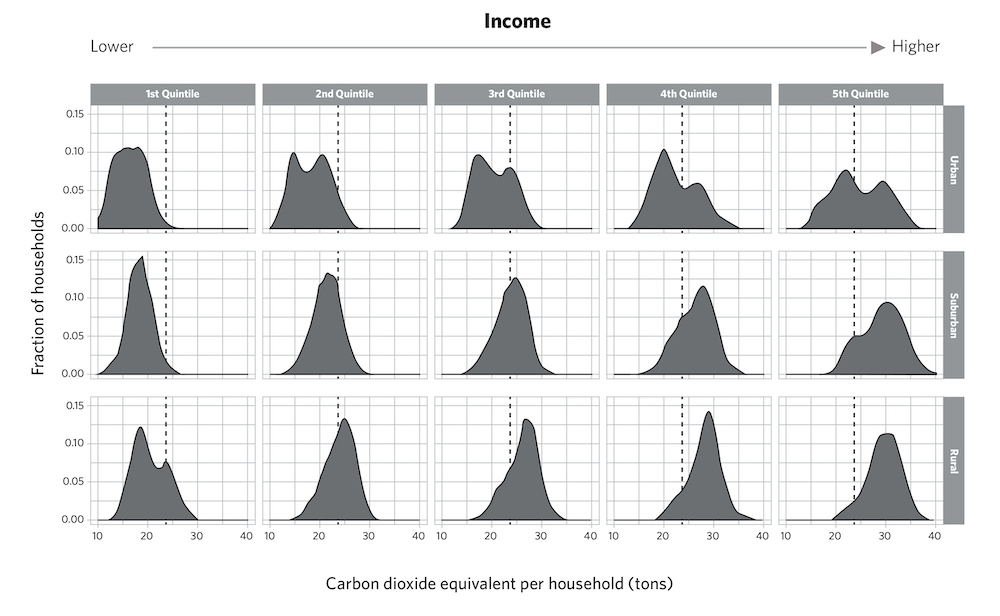
Total household carbon footprints across income quintiles and urbanicity compared to the U.S. average. This chart divides U.S. households into five equal-sized income groups (“quintiles”), with income increasing from the left column to the right. The three rows from top to bottom show results for urban, suburban, and rural areas. Within each quintile, the shaded area represents the distribution of household carbon footprints compared to the U.S. average, which is indicated by the dashed line. Overall, household carbon footprints tend to increase with wealth and in more rural locations. In addition, there can be a wide and sometimes bimodal distribution within each grouping. The bimodal feature occurs when people living in middle of the country have the same income as those living on the coasts but have a higher carbon footprint because their power grid is dirtier.
How equitable are carbon tax policies?
Armed with estimates of average household carbon footprints across the United States, Knittel and Green were ready to model various versions of a carbon tax policy to estimate the annual cost and benefit for the average household at the census tract level. The policy that’s most often discussed is a “tax-and-dividend plan” that taxes carbon, collects the revenues, and redistributes the collected money equally across households, so every household receives the same check. In light of the researchers’ broad lessons concerning carbon footprints, they asked: Is that system fair for everyone?
The fact that wealthy people consume more carbon is good for the equity of the plan because it means that wealthier households would pay more. Indeed, the researchers found that, on average, low-income households would actually receive a larger dividend check than what they would pay in increased prices due to carbon taxes. Thus, the policy is not regressive, but rather progressive; it benefits people with lower incomes.
However, the other two broad lessons lead to inequitable outcomes from this simple tax-and-dividend plan, the researchers say. With carbon footprints generally higher in Middle America and lower on the coasts, the former regions would pay more than the latter. In essence, there would be a transfer of money from Middle America to the coasts. And with carbon footprints higher in rural and suburban areas than in cities, there would be a transfer of money from rural and suburban households to urban households. Both of those outcomes mean that the simple carbon tax-and-dividend plan is inequitable: Households in Middle America and in rural and (to some extent) suburban areas would carry more of the overall burden of the tax than others.
But there’s a way to design a tax-and-dividend policy to keep those two negative outcomes from occurring: Send different dividend checks to different households. Using their model, the researchers examined the impacts of carbon tax-and-dividend policies with the same per-ton carbon fee but with differing dividends based on geographic location in the country or in urban, suburban, or rural locations. Their results showed that a small adjustment in the dividend checks—as little as 8%—would solve the inequity problem.
Inequity in other proposed policies
For Knittel, a final takeaway from the study is that alternatives to a carbon tax “don’t look great at all.” For example, both clean energy standards and renewable portfolio standards—common policies designed to reduce emissions—focus on decarbonizing the electric grid (the latter excludes nuclear power). But the middle of the United States relies on a particularly dirty grid, so those policies will again be more costly for people in the middle of the country than for those on the coasts. Fuel economy standards focus on vehicles, and people in the middle of the country and in rural areas tend to drive more miles and have less fuel-efficient cars, so such policies will place them at an economic disadvantage.
But perhaps the biggest drawback of such regulations is that—unlike a carbon tax—they don’t generate revenue. “So there’s no way to undo the negative impacts,” says Knittel. Unless policy makers can find another source of revenue, they have no flexibility to protect certain groups.
Practical implications
What is the message for policy makers? A policy that taxes carbon emissions is more efficient and less costly overall than other frequently proposed policies. “But it’s critical to design any carbon tax-and-dividend policy carefully and intelligently to avoid some of the inequities that may arise and the political pitfalls that can result,” says Knittel.
In terms of how to design the refund checks, he has a suggestion. There are 10 census divisions in the United States, and he proposes sending different checks to households based on those divisions, with bigger checks going to those in the middle of the United States and to rural and suburban areas.
But he stresses that the decision is up to policy makers. “My goal is to give policy makers data with which they can make informed decisions in the interest of their constituents,” he says. And his analytical techniques are available to help decision makers assess the implications of specific policies being considered.
As an example, he describes an experience in December 2021. At that time, there was considerable discussion about a federal budget reconciliation package, and for a while, a carbon tax seemed to be on the table, including a version that exempted gasoline from such a tax. “I began receiving requests from policy makers and staffers in D.C. to generate new maps for them so they could see what different carbon tax proposals would look like,” he recalls. Did he and his team do so? His response: “Of course we did! We were generating multiple maps on a daily basis.” As the debate unfolded, policy makers could see in detail the impacts of specific climate-motivated policies on different populations, including their own constituents.
The researchers conclude that—done well—a carbon tax-and-dividend policy could serve as a good, bipartisan, “win-win” option that would benefit constituents in progressive and conservative districts alike.
This research was funded by the Emerson Collective through the Roosevelt Project, under the MIT Center for Energy and Environmental Policy Research. The goal of the Roosevelt Project is to provide an analytical basis for charting a path to a low-carbon economy in a way that promotes high-quality job growth, minimizes worker and community dislocation, and harnesses the benefits of energy technologies for regional economic development. This Energy Futures article is based on the following special report published by the Roosevelt Project:
T.W. Green and C.R. Knittel. “Distributed effects of climate policy: A machine learning approach.” MIT Center for Energy and Environmental Policy Research, The Roosevelt Project Special Working Paper Series, 2020. Online: The-Roosevelt-Project-WP-3.pdf. More publications from the Roosevelt Project: ceepr.mit.edu/roosevelt-project/publications.
This article appears in the Spring 2022 issue of Energy Futures.