
In Brief
Using electrodes made of carbon nanotubes (CNTs) can significantly improve the performance of devices ranging from capacitors and batteries to water desalination systems. But figuring out the physical characteristics of vertically aligned CNT arrays that yield the most benefit has been difficult. Now an MIT team has developed a method that can help. By combining simple benchtop experiments with a model describing porous materials, the researchers have found they can quantify the morphology of a CNT sample—without destroying it in the process. In a series of tests, they confirmed that their adapted model can reproduce key measurements taken on CNT samples under varying conditions. They’re now using their approach to determine detailed parameters of their samples—including the spacing between the nanotubes—and to optimize the design of CNT electrodes for a device that rapidly desalinates brackish water.
A common challenge in developing energy storage devices and desalination systems is finding a way to transfer electrically charged particles onto a surface and store them there temporarily. In a capacitor, for example, ions in an electrolyte must be deposited as the device is being charged and later released when electricity is being delivered. During desalination, dissolved salt must be captured and held until the cleaned water has been withdrawn.
One way to achieve those goals is by immersing electrodes into the electrolyte or the saltwater and then imposing a voltage on the system. The electric field that’s created causes the charged particles to cling to the electrode surfaces. When the voltage is cut, the particles immediately let go.

Critical to their method are simple benchtop experiments in electrochemical cells such as the one shown here. Three electrodes—one of them a CNT sample—are immersed in an electrolyte, and current flow and other measurements are taken as voltage is pulsed into the system. Photo: Stuart Darsch
“Whether salt or other charged particles, it’s all about adsorption and desorption,” says Heena Mutha PhD ’17, now a senior member of technical staff at Draper. “So the electrodes in your device should have lots of surface area as well as open pathways that allow the electrolyte or saltwater carrying the particles to travel in and out easily.” One way to increase the surface area is by using carbon nanotubes (CNTs). In a conventional porous material such as activated charcoal, interior pores provide extensive surface area, but they’re irregular in size and shape so accessing them can be difficult. In contrast, a CNT “forest” is made up of aligned pillars that provide the needed surfaces plus straight pathways so the electrolyte or saltwater can easily reach them.
However, optimizing the design of CNT electrodes for use in devices has proven tricky. Experimental evidence suggests that the morphology of the material—in particular, how the CNTs are spaced out—has a direct impact on device performance. Increasing the carbon concentration when fabricating CNT electrodes produces a more tightly packed forest and more abundant surface area. But at a certain density, performance starts to decline, perhaps because the pillars are too close together for the electrolyte or saltwater to pass through easily.
Designing for device performance
“Much work has been devoted to determining how CNT morphology affects electrode performance in various applications,” says Professor Evelyn Wang of mechanical engineering. “But an underlying question is, how can we characterize these promising electrode materials in a quantitative way so as to investigate the role played by such details as the nanometer-scale inter-spacing?” Inspecting a cut edge of a sample under a scanning electron microscope (SEM) provides images like those shown below, but quantifying features such as spacing is difficult, time-consuming, and not very precise. Analysis of data from gas adsorption experiments works well for some porous materials but not for nanotube forests. Perhaps more important, such methods destroy the material being tested, so samples whose morphologies have been characterized can’t be used in tests of overall device performance.
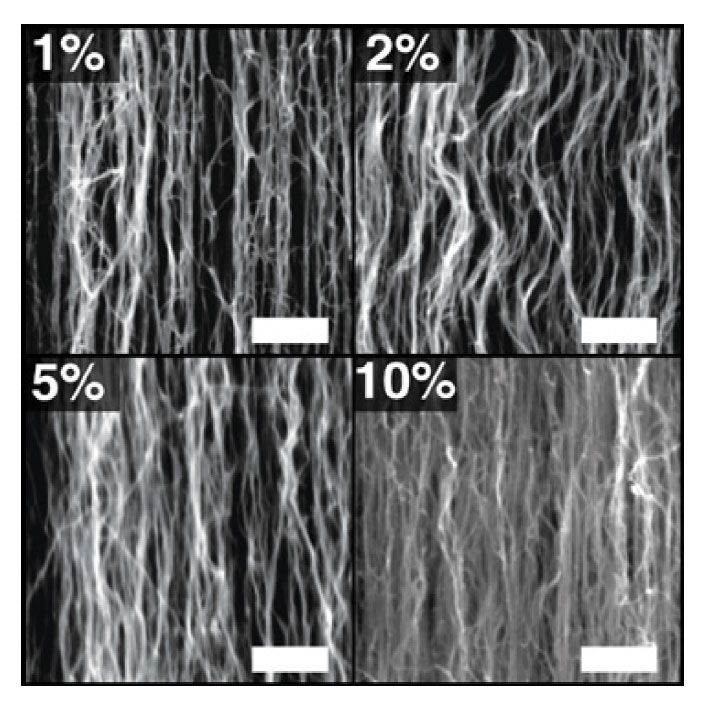
Scanning electron microscope (SEM) images of carbon nanotube coatings These SEM images show samples of carbon nanotube forests at varying volume fractions. At top left is the as-fabricated sample with a volume fraction of 1% (meaning that 1% of the total volume is occupied by nanotubes). The other images show samples that have been densified to volume fractions of 2%, 5%, and 10%. The scale bar on each image is 500 nanometers.
For the past two years, Wang and Mutha have been working on a better option. “We wanted to develop a nondestructive method that combines simple electrochemical experiments with a mathematical model that would let us ‘back calculate’ the interspacing in a CNT forest,” says Mutha. “Then we could estimate the porosity of the CNT forest—without destroying it.”
Adapting the conventional model
One widely used method for studying porous electrodes is electrochemical impedance spectroscopy (EIS). It involves pulsing voltage across electrodes in an electrochemical cell at a set time interval (frequency) while monitoring impedance, a measure that depends on both the available storage space and the resistance to flow. The set of impedance measure-ments at different frequencies is called the frequency response.
The classic model describing porous media uses that frequency response to calculate how much open space there is in a porous material. “So we should be able to use it to calculate the space between the carbon nanotubes in a CNT electrode,” says Mutha.
But there’s a problem. The classic model assumes that all pores are uniform, cylindrical voids, as shown in the left-hand drawing below. But that description doesn’t fit electrodes made of CNTs. Mutha therefore modified the model to more accurately define the pores in CNT materials as the void spaces surrounding solid pillars, as indicated by the blue areas in the four drawings of different CNT packing geometries. While others have similarly altered the classic model, she took one more step. The nanotubes in a CNT material are unlikely to be packed uniformly. She therefore added to her equations the ability to account for variations in the spacing between the nanotubes—a more realistic representation of the structure inside a CNT electrode.
With this modified porous media model, Mutha could analyze EIS data from real samples to calculate CNT spacings.
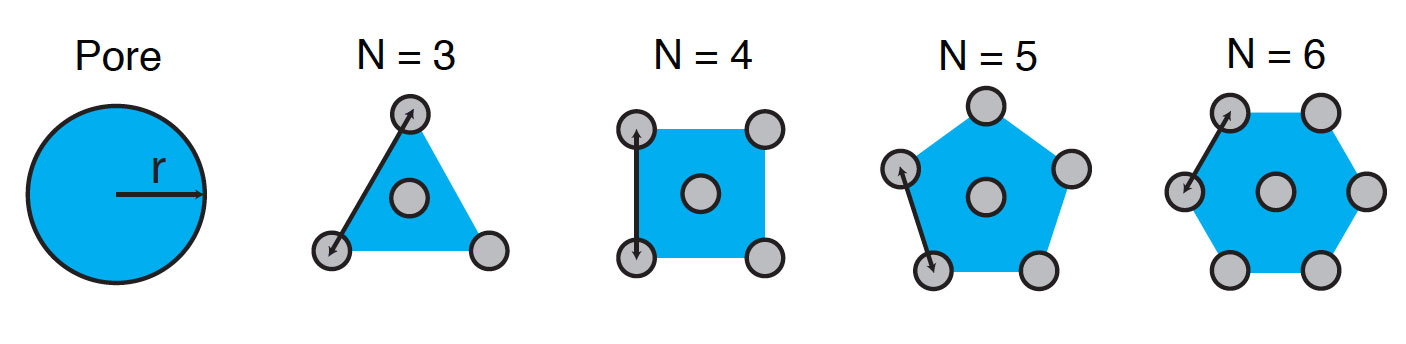
Packing geometry in porous material modeling The classic porous media model—designed for studies of conventional materials such as activated carbon—describes all voids as cylindrical openings, as shown in the left-hand drawing above. In carbon nanotube materials, the open pores are instead the spaces among the solid pillars, and the geometry defined depends on the number of nanotubes (N) that pack together in a repeating cell, as shown in the other four drawings.
Using the model
To demonstrate her approach as an analytical tool for determining CNT spacing, Mutha first fabricated a series of laboratory samples and then measured their frequency response. In collaboration with Yuan “Jenny” Lu SB ’15 of materials science and engineering, she deposited thin layers of aligned CNTs onto silicon wafers inside a furnace and then used water vapor to separate the CNTs from the silicon, producing free-standing forests of nanotubes. To vary the CNT spacing, she used a technique developed by MIT collaborators Professor Brian Wardle of aeronautics and astronautics and Itai Stein PhD ’16, now a post doctoral associate in the same department. Using a specially fabricated plastic device, she mechanically squeezed her samples from four sides, thereby packing the nanotubes together more tightly and increasing the volume fraction, that is, the fraction of the total volume occupied by the solid CNTs.
The SEM images above show cross sections of four of her samples. The first image shows her original fabricated sample, which has a volume fraction of about 1% (estimated based on density measurements). The other three images show samples with volume fractions of 2% (the sample has been reduced to half its original area), 5%, and 10%. As the volume fraction increases, the spaces between the nanotubes in the forest decrease, and the individual nanotubes become more upright and less curvy.
To test the frequency response of the samples, she used a glass beaker containing three electrodes immersed in an electrolyte. One electrode is the CNT-coated sample being tested, while the other two are used to monitor the voltage and to absorb and measure the current that flows. Using that setup, she first measured the capacitance of each sample, that is, how much charge it could store in each square centimeter of surface area at a given constant voltage. She then ran EIS tests on the samples and analyzed results using her modified porous media model.
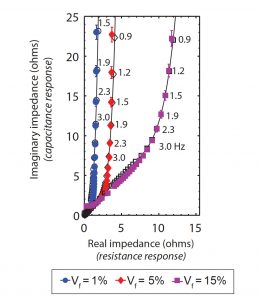
Frequency response of samples with varying volume fractions This figure shows how the impedance response changes as samples of differing volume fractions (Vf) are subjected to pulses of voltage input at frequencies ranging from 3.0 to 0.9 hertz (cycles per second). The colored symbols are experimental measurements; the black lines are model calculations. The measured and calculated values show the same trends, with a gradual transition toward constant resistance as the pulses become less frequent, allowing more time for the voltage to penetrate and the sample to respond.
The figure above shows her experimental and theoretical results. The impedance response is made up of two components: the resistance response (on the X-axis) and the capacitance response (on the Y-axis). Measurements appear as colored symbols and model calculations as black lines. Frequencies range from 3.0 to 0.9 hertz (cycles per second), as indicated by numbers beside the data points.
Results for the three volume fractions tested show the same trends. As the voltage pulses become less frequent, the curves initially rise at about a 45° slope. But at some point each one shifts toward vertical, with resistance becoming constant and impedance continuing to rise.
As Mutha explains, those trends are typical of EIS analyses. “At high frequencies, the voltage changes so quickly that—because of resistance in the CNT forest—it doesn’t penetrate the depth of the entire electrode material, so the response comes only from the surface or partway in,” she says. “But eventually the frequency is low enough that there’s time between pulses for the voltage to penetrate and for the whole sample to respond.” Resistance is no longer a noticeable factor, so the line becomes vertical, with the capacitance component causing impedance to rise as more charged particles attach to the CNTs. That switch to vertical occurs earlier with the lower-volume-fraction samples. In sparser forests, the spaces are larger, so the resistance is lower.
The most striking feature of Mutha’s results is the gradual transition from the high-frequency to the low-frequency regime. Calculations from a model based on uniform spacing—the usual assumption—show a sharp transition from partial to complete electrode response. Because Mutha’s model incorporates subtle variations in spacing, the transition is gradual rather than abrupt. Her experimental measurements and model results both exhibit that behavior, suggesting that the modified model is more accurate.
By combining their impedance spectroscopy results with their model, the researchers inferred the CNT interspacing in their samples. Since the forest packing geometry is unknown, they performed the analyses based on the three- and six-pillar configurations shown on page 24 to establish upper and lower bounds. Their calculations showed that spacing can range from 100 ± 50 nanometers (nm) in sparse forests to below 10 ± 5 nm in densely packed forests.
Comparing approaches
Work in collaboration with MIT colleagues Wardle and Stein has validated the two groups’ differing approaches to determining CNT morphology. In their studies, Wardle and Stein use an approach similar to Monte Carlo modeling, which is a statistical technique that involves simulating the behavior of an uncertain system thousands of times under varying assumptions to produce a range of plausible outcomes, some more likely than others. For this application, they assumed a random distribution of “seeds” for carbon nanotubes, simulated their growth, and then calculated characteristics such as inter-CNT spacing with an associated variability. Along with other factors, they assigned some degree of waviness to the individual CNTs to test the impact on the calculated spacing.
To compare their approaches, the two MIT teams performed parallel analyses that determined average spacing at increasing volume fractions. The figure below shows results from Mutha’s EIS analyses (dots) and Stein’s simulations (curves), assuming either three-pillar packing (red) or six-pillar packing (blue). The trends they exhibit match well, with spacing decreasing as volume fraction increases. However, at a volume fraction of about 26%, the EIS spacing estimates suddenly go up—an outcome that Mutha believes may reflect packing irregularities caused by buckling of the CNTs as she was densifying them.
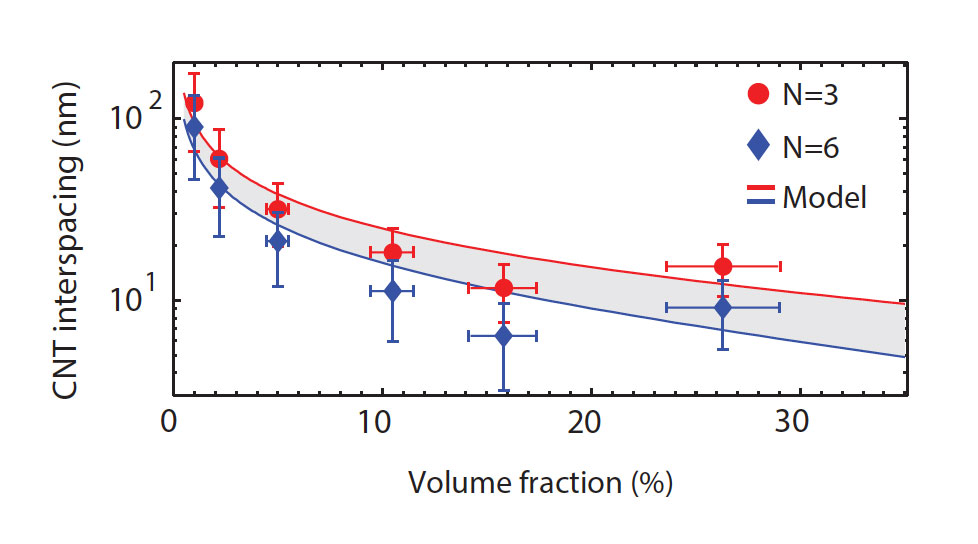
Comparing results from EIS analysis and Monte Carlo modeling This figure shows spacing between nanotubes in CNT coatings at various volume fractions. The dots show estimates from the EIS analysis; the solid lines are results from a statistical model that simulates carbon nanotube growth. The studies both considered three-pillar packing (red) and six-pillar packing (blue)—assumptions designed to establish the upper and lower bounds of possible spacing. The results show similar trends until the volume fraction reaches about 26%, when the CNTs in the experimental samples may have buckled during densification.
To investigate the role played by waviness, Mutha compared the variabilities in her results with those in Stein’s results from simulations assuming different degrees of waviness. At high volume fractions, the EIS variabilities were closest to those from the simulations assuming little or no waviness. But at low volume fractions, the closest match came from simulations assuming high waviness.
Based on those findings, Mutha concludes that waviness should be considered when performing EIS analyses—at least in some cases. “To accurately predict the performance of devices with sparse CNT electrodes, we may need to model the electrode as having a broad distribution of interspacings due to the waviness of the CNTs,” she says. “At higher volume fractions, waviness effects may be negligible, and the system can be modeled as simple pillars.”
The researchers’ nondestructive yet quantitative technique provides device designers with a valuable new tool for optimizing the morphology of porous electrodes for a wide range of applications. Already, Mutha and Wang have been using it to predict the performance of supercapacitors and desalination systems. Recent work has focused on designing a high-performance, portable device for the rapid desalination of brackish water (see photo below). Results to date show that using their approach to optimize the design of CNT electrodes and the overall device simultaneously can as much as double the salt adsorption capacity of the system while speeding up the rate at which clean water is produced.
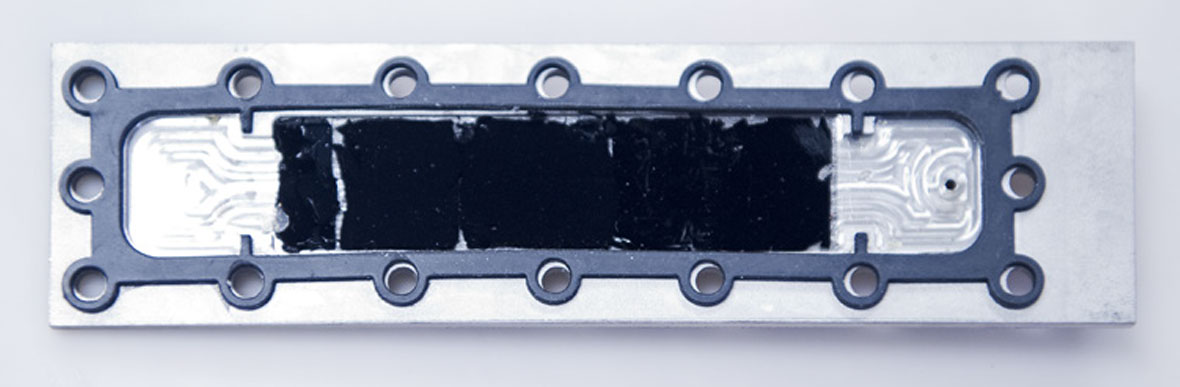
The researchers tested the use of their CNT electrodes for capacitive deionization, a low-cost approach to desalinating brackish water. They attached CNT electrodes to titanium current collectors—as shown above—and used those prototypes to study the dynamics of salt removal and to optimize device design. By manipulating the volume fraction, height, and surface chemistry of the CNTs, they varied the rate of salt removal and overall system capacity. Photo: Stuart Darsch
Notes
This research was supported in part by the MIT Energy Initiative Seed Fund Program and by the King Fahd University of Petroleum and Minerals (KFUPM) in Dhahran, Saudi Arabia, through the Center for Clean Water and Clean Energy at MIT and KFUPM. Heena Mutha was supported by a National Science Foundation Graduate Research Fellowship and Itai Stein by the Department of Defense through the National Defense Science and Engineering Graduate Fellowship Program. Further information can be found in the following:
H.K. Mutha, Y. Lu, I.Y. Stein, H.J. Cho, M.E. Suss, T. Laoui, C.V. Thompson, B.L. Wardle, and E.N. Wang. “Porosimetry and packing morphology of vertically aligned carbon nanotube arrays via impedance spectroscopy.” Nanotechnology, vol. 28, no. 5, 2017.
DOI: 10.1088/1361-6528/aa53aa.
I.Y. Stein and B.L. Wardle. “Packing morphology of wavy nanofiber arrays.” Physical Chemistry Chemical Physics, vol. 18, pp. 694–699, 2016. DOI: 10.1039/C5CP06381G.
This article appears in the Autumn 2017 issue of Energy Futures.