
Overview
A new MIT analysis shows that the standard method used to determine the climate impacts of promising energy technologies may overestimate the benefits to be gained over the next several decades. The problem? The conventional approach doesn’t account for the timing of emissions and as a result doesn’t calculate the full impact of methane emitted by many energy technologies. Using novel “dynamic” metrics in a sample analysis, the MIT researchers found that the current advantage of generating electricity with natural gas rather than coal shrinks in half within three decades, and using compressed natural gas in place of gasoline as a transportation fuel is worse for the climate by 2030. The good news is that investments in reducing methane leaks and tracking and regulating methane emissions can significantly improve those outcomes.
Concern about future climate change is motivating major changes in today’s energy landscape. For example, electric power producers are switching from coal to natural gas in part to reduce carbon dioxide (CO2) emissions. But recovering and transporting natural gas gives off methane, which is a relatively short-lived but highly potent greenhouse gas (GHG). Meanwhile, researchers are working to develop new technologies that promise to be more climate-friendly than those we use now. How can we be sure that such investments will provide the predicted climate benefits in the future?
Determining the climate impacts of technology options over the long term is critical, says Jessika E. Trancik, the Atlantic Richfield Career Development Assistant Professor in Energy Studies. “Some components of the energy infrastructure that we’re building now will be around for 30 or 40 years, and our research funding decisions today are committing us to…certain technologies that will come online 10 or 20 years in the future,” says Trancik. “So we need to assess the impacts of those technologies not just today but also 10, 20, 30 years into the future.”
Performing such assessments is tricky. Different technologies emit different GHGs, and those GHGs have varying abilities to trap heat in Earth’s atmosphere—a phenomenon called radiative forcing. They also remain in the atmosphere for different lengths of time. For example, a gram of methane (the main component in natural gas) causes about 100 times more radiative forcing than a gram of CO2 does. But while CO2 hangs around in the atmosphere for centuries, methane disappears in a few decades.
Global Warming Potential
To determine our best technology options, analysts and modelers generally convert quantities of all GHGs into “CO2 equivalents”—that is, the number of units of CO2 that will produce the same climate impact as one unit of the GHG. They can then compare the long-term emissions impacts of technologies (per unit energy produced) on a common scale.
Since the 1990s, analysts have performed such conversions using a metric called the global warming potential, or GWP. Its value is equal to the ratio between the total amount of heat trapped by a given GHG and by the same mass of CO2 over a set period of time—typically 100 years. Based on such an analysis, the radiative forcing of a gram of methane is 25 times greater than that of a gram of CO2 over the 100-year time span. The analyst can thus convert each gram of methane in the atmosphere into 25 grams of CO2, producing a common basis for comparing technologies.
Radiative forcing of methane and CO2 over time
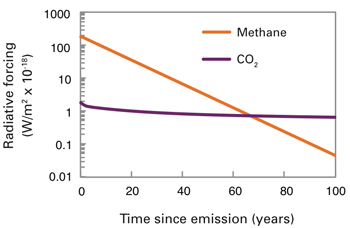
These curves show the radiative forcing of single pulses of CO2 and methane over 100 years. Initially, the methane has 102 times the radiative forcing (per gram) of CO2. But it decays more quickly. By year 67, the radiative forcing of the two gases is about equal. A climate impact assessment must therefore consider each GHG emitted by a technology and take into account its radiative forcing and rate of decay in the atmosphere.
But Trancik argues that we don’t have 100 years. “The problem is that now we’re actually closer to reaching and potentially exceeding the commonly cited climate targets,” she says. “If our time frame for stabilizing radiative forcing is 20 or 30 years, we shouldn’t use the 100-year GWP for our analysis.”
The first figure illustrates her concern. Assume that 1 gram of CO2 and 1 gram of methane enter the atmosphere at time zero. The curves show the radiative forcing of those initial pulses in each year between the start time and an end time 100 years later. Today, the radiative forcing of the methane pulse is more than 100 times that of the CO2 pulse. As time passes, the radiative forcing of the initial CO2 pulse changes very little. But the radiative forcing of the methane pulse decreases rapidly because less and less of it remains in the atmosphere. By year 67, the remaining CO2 and methane have about the same impact, and thereafter the relative role of the methane continues to decline. So if the point in time at which we intend to stabilize radiative forcing is, say, 50 years in the future, using the GWP conversion factor based on the cumulative impact over 100 years is going to give the wrong answer.
The new, dynamic metrics
To solve that problem, Trancik and Morgan R. Edwards, a graduate student in engineering systems, devised two new dynamic metrics. With those metrics, the conversion factor changes year by year, and—most importantly— each factor depends on how long before the stabilization year the pulse is emitted. Here’s why: If a methane pulse enters the atmosphere early in the selected time period, it will have decayed considerably by the end year. But if that pulse is emitted in the stabilization year, it will have no time to decay. The conversion factor for that pulse should be 100, that is, each gram of methane should become 100 grams of CO2.
Their first metric—the cumulative climate impact (CCI)—takes into account the cumulative contribution over time of a pulse of emission from its release to the stabilization year. The GWP also accounts for a cumulative contribution but—as stated earlier—the GWP conversion factor is constant, regardless of when the pulse of emission occurs. In contrast, the CCI conversion factor changes over time as the stabilization year nears.
As an example, assume a 30-year time horizon. Take a pulse of methane in year 1 and determine its cumulative radiative forcing over the 30 years (taking into account its decay over time). Follow the same procedure for a pulse of CO2 in year 1. Divide the two results to get the conversion factor for year 1. Perform the same calculation year by year to get ratios for converting methane to CO2 equivalents in each year for the 30-year time horizon.
The second metric—the instantaneous climate impact (ICI)—focuses on the radiative forcing in the stabilization year. It is less conservative than the CCI, putting less emphasis than the CCI on emissions in years leading up to stabilization. (The choice of metric should be guided by the policy context.) To determine this metric, take each pulse of CO2 and of methane in a given year and track their decay in each subsequent year. At the end year, take the ratio between the remaining CO2 and the remaining methane. That ratio is the conversion factor for the year the pulses were emitted.
Radiative forcing trajectories to stabilize at 3 W/m2 under feasible emissions scenarios
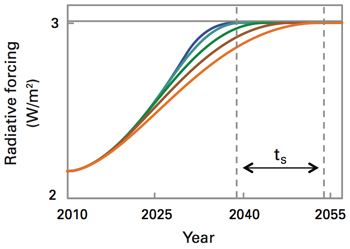
Using the new dynamic metrics requires defining an intended stabilization level but not the exact emissions scenario planned for achieving it. Only certain emissions scenarios are practical for achieving a given target, and taken together, they define a finite time frame for performing an analysis with the new metrics. To demonstrate, the researchers selected a stabilization target of 3 W/m2and then examined five possible radiative forcing trajectories reflecting emissions scenarios with a range of start times and emissions growth rates. As the curves above show, the time frame for reaching the stabilization target using any of the scenarios spans just 15 years—from roughly 2040 to 2055.
Sample technology assessment
As a demonstration, Trancik and Edwards performed a sample technology assessment. To start out, they selected a single input: the radiative forcing stabilization target, that is, the amount of additional heating that occurs at the time when new emissions are exactly balanced by their natural loss. (Says Trancik, “For a metric to be usable, it has to require only limited information about the future—which is inherently uncertain—but still perform well.”) For their assessment, they chose a stabilization target of 3 watts per square meter (W/m2), which in equilibrium is associated with a 2°C temperature change—a frequently cited climate policy goal.
The next step was to translate that target into a time frame for the analysis. They devised five possible emissions scenarios for reaching that target, assuming only CO2 emissions. At one extreme is a scenario that imposes gradual cuts in emissions starting right away; at the other extreme is one that starts much later and then imposes far more severe cuts in each year. Based on the five emissions scenarios, they determined that the time frame for achieving the stabilization target of 3 W/m2 is constrained to a 15-year range—from about 2040 to 2055 (see the second figure). As a result, they can perform their technology evaluation using only the stabilization target and this limited range of years. There’s no need to define the exact stabilization scenario to be followed.
Next, they used the CCI and ICI as well as the GWP to assess the climate impacts of several prominent energy technologies. The figures below show results from an analysis based on the middle emissions scenario, which brings stabilization at 3 W/m2 in about 2042.
Comparisons of technologies using the three metrics
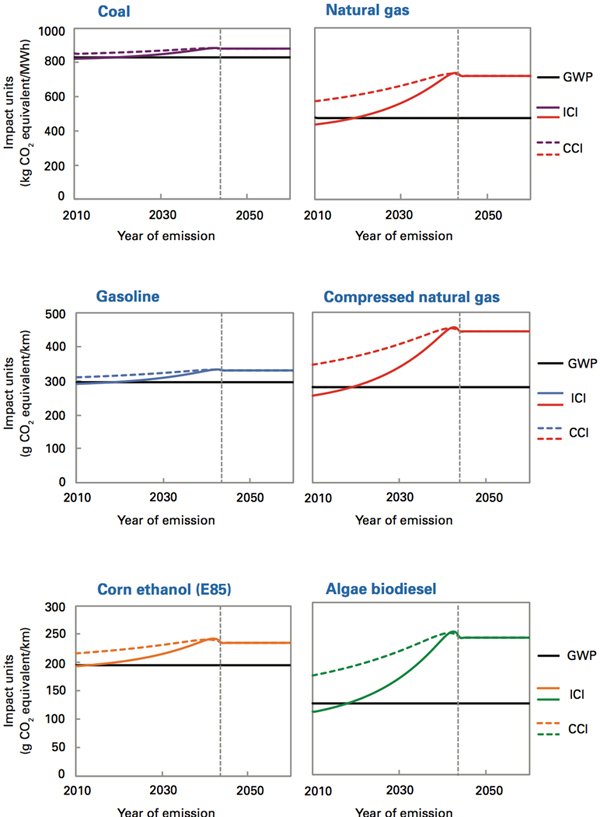
These figures present results of analyzing the climate impacts of six technologies, considering both CO2 and methane emissions and focusing on a CO2-emissions scenario designed to bring climate stabilization at 3 W/m2 in about 40 years. With the constant GWP conversion factor, the relative impacts of the pairs of technologies do not change over time. With the new dynamic metrics—the CCI and the ICI—the conversion factor changes from year to year. In those analyses, by the end of 42 years, the climate advantages of the technologies involving natural gas and algae biodiesel have declined due to their high emissions of methane.
Coal-fired and natural gas-fired electricity. The top two figures present results from analyses of using coal and natural gas to generate electricity. (Methane leakage from the natural gas is assumed to be constant in the figures shown here, but this assumption could be adjusted and the same method applied.) The GWP analysis shows that the climate impact of natural gas electricity is about half that of coal electricity over the whole time period. In contrast, the CCI and ICI analyses show that the advantage of natural gas decreases over time. While the climate impact of natural gas in initially about 50% that of using coal, within three decades it grows to 75%. Many experts advocate natural gas as a “bridging fuel” to a low-carbon future, but the new analyses demonstrate the importance of getting to the other end of the bridge relatively soon.
Gasoline and compressed natural gas (CNG). The middle two figures show results for gasoline and CNG used for transportation. Here, the GWP shows that CNG offers some climate benefit over gasoline. The CCI and ICI analyses show that CNG used today ranges from slightly advantageous to slightly disadvantageous, whereas CNG used in 2040 has a significantly higher impact on the climate than gasoline does.
Corn ethanol and algae biodiesel for transportation. The bottom figures show results for corn E85 (a blend of 85% corn ethanol and 15% gasoline) and for algae biodiesel. The latter case is for a production process that involves a biodigester, which emits some methane. The GWP-based analysis shows that corn ethanol provides a significant climate advantage over algae biodiesel. But in the CCI and ICI analyses, the climate impact of algae biodiesel overtakes that of corn ethanol within two to three decades—a change attributable to the methane leakage from the biodigester.
Those sample results demonstrate that the ability of any technology to avert or slow climate change depends in part on methane emissions—not only the quantity but also the timing of their release. “So our findings point to the importance of mitigating methane emissions in addition to CO2 emissions,” Trancik says. “And there are a lot of opportunities for doing that, including reducing methane emissions from biodigesters and cutting methane leaks along the natural gas supply chain.” Making those changes will require money and time, so quantifying the potential gains from such investments is critical.
The results also emphasize the importance of more stringent tracking and regulation of methane emissions. Once again, the new metrics can help. The metrics are based on physical emissions and their radiative forcing characteristics. As a result, they can be used to calculate values for “exchanges” on emissions trading markets, and they can help guide the design of emissions-control regulations that will more successfully meet their climate targets than will regulations based on GWP calculations. Exploring the various roles that the new metrics can play in technology- and emissions-related policy making is the subject of ongoing research by Trancik and her colleagues.
This research was funded by the US Department of Transportation through the New England University Transportation Center at MIT. Current work on this topic, building on the results described here, is being funded by the MIT Energy Initiative Seed Fund Program. Further information can be found in:
M.R. Edwards and J.E. Trancik. “Climate impacts of energy technologies depend on emissions timing.” Nature Climate Change, vol. 4, pp. 347–352, May 2014.
J.E. Trancik, M.T. Chang, C. Karapataki, and L.C. Stokes. “Effectiveness of a segmental approach to climate policy.” Environmental Science & Technology, vol. 48, no. 1, pp. 27–35, 2014.
This article appears in the Autumn 2014 issue of Energy Futures.