Overview
Much energy is wasted heating and cooling indoor spaces when no one or almost no one is present. Now, MIT researchers have used their own campus to demonstrate a means of measuring that energy/occupancy mismatch—a first step toward finding strategies to correct it. Their method uses existing infrastructure, namely, connections on MIT’s wireless network as an indicator of occupancy plus energy-use data gathered by sensors that monitor building operations. Analysis of 2006 data from two MIT buildings shows that two-thirds of the variation in electricity levels corresponds to changing occupancy levels. But energy used for heating and cooling shows almost no correlation with occupancy. The MIT team suggests changes in how commercial buildings are designed and used that may help bring energy and people together in time and space.
In the search for energy-saving opportunities, commercial buildings are a good place to look. According to the US Energy Information Administration, commercial buildings account for nearly 20% of US energy consumption and 12% of the nation’s greenhouse gas emissions. Yet studies have shown that continuously monitoring and adjusting operations and implementing a small number of energy-efficiency strategies could reduce that energy use by as much as 30%.
One challenge in commercial buildings is providing the “right” amount of heating and cooling. With people constantly coming and going, energy use is frequently either too high or too low for the number of people present. A lecture hall on a college campus provides a striking example. Students flood into the hall for class, and then after 90 minutes the hall is empty—but still being heated or cooled. “It takes a lot of energy to heat up that room, but much of the day nobody’s there,” says Carlo Ratti, director of the MIT SENSEable City Laboratory and associate professor of the practice in MIT’s Department of Urban Studies and Planning (DUSP). “If we can understand that kind of mismatch between energy use and occupancy, we may be able to make changes in how we distribute energy or in how we design or use space that could reduce energy use, costs, and environmental impacts.”
Past studies have examined the relationship between energy use and occupancy, but they have focused on single buildings and yielded inconclusive results. Performing the needed large-scale field experiments could require installing a pervasive system of sensors to collect data on building operations and occupancy—an undertaking that would be both expensive and intrusive.
Using existing infrastructure
Three years ago, Ratti realized that the needed technology is already in place on the MIT campus. The Institute has a network of more than 100,000 sensors that monitor the functioning of MIT’s building automation systems across campus and in turn reveal the per-building consumption of electricity, chilled water for cooling, and high-temperature steam for heating. The campus also has a means of tracking occupancy: via its ubiquitous WiFi network, which includes more than 5,000 hotspots, almost one per room and hallway. In 2005, when the campus-wide wireless network was relatively new, Ratti and his colleagues performed iSPOTS, a project investigating how WiFi was changing the working habits of the MIT community. A legacy of that project is a rich historical database on WiFi use as well as evidence that WiFi connections are a good indicator of where people are and when.
Pairing up the data from MIT’s building sensors and WiFi system might provide insights into the nature and extent of the energy/occupancy mismatch. And the MIT campus would be a good “test bed” for trying out that approach. Its many buildings vary in age, construction, and use; and they have unusual “occupancy profiles.” In most commercial buildings, groups of workers come and go at fairly predictable times of day. But in academic buildings, people are more likely to enter and exit at irregular times, occupancy can vary widely over short periods, and there may be long stretches of time when buildings are almost—but not quite—empty. Such conditions make the efficient distribution of energy a particular challenge.
For their initial study, the MIT team focused on the Sloan Building (E52) and the Ronald M. McNair Building (M37). The functions of those two buildings are distinctly different. M37 is predominantly composed of laboratories, while E52 is a more typical working space with classrooms, offices, and open reception areas. Drawing on the iSPOTS project, the researchers gathered detailed data on WiFi use in those buildings in 2006. And aided by MIT’s Department of Facilities, they obtained the 2006 energy consumption data they needed.
Tracking energy usage and occupancy
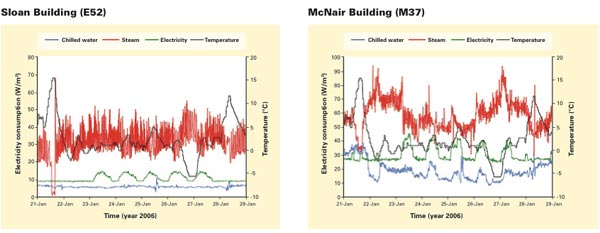
The curves below show data on energy use in the two buildings during eight days in winter 2006. The curves show hourly readings for electricity (green), chilled water (blue), and steam (red). All data are converted to a standardized unit—kilowatts—and then normalized by area—watts per square meter—so the datasets for the two buildings can be compared. The final curve (black) shows outdoor air temperatures measured at Logan International Airport in Boston.
Hourly energy consumption in two MIT buildings plus outdoor temperatures, January 21–28, 2006

Hourly energy use for chilled water (for air conditioning), steam (for heat), and electricity during eight days in winter 2006 shows distinctly different profiles in two MIT buildings: the Sloan Building, E52 (left), and the Ronald M. McNair Building, M37 (right). Electricity use in both buildings displays steady baseline consumption superimposed by daytime peaks on weekdays. But chilled water and steam consumption in the two buildings show differing trends, sometimes but not always correlating to changes in outdoor temperatures. Notably, all energy use is significantly higher in McNair than in Sloan.
Consumption patterns for the two buildings display both similarities and differences. In E52, electricity use shows pronounced recurring daily cycles, peaking during the daytime and returning to baseline levels at night and on weekends. Similar cycles appear in the M37 data, but the constant background level is about three times higher than in E52, perhaps because the M37 labs contain equipment that must operate continuously and therefore need a constant supply of electricity.
Consumption of chilled water and steam is likewise far higher in M37 than in E52. Chilled water use in E52 is relatively flat, while that in M37 shows considerable variation, including some daytime peaks. Steam consumption in M37 follows variations in outdoor temperature. In E52, steam use rises and falls frequently, sometimes correlated with outdoor temperature, but the overall range of values encompassed is far smaller than in the M37 data.
Analysis of comparable data from spring, summer, and autumn shows little seasonal variation in patterns of electricity use in the two buildings. Far more variation is evident in chilled water and steam consumption. In E52, there are two distinct usage patterns for chilled water and steam, one in winter and spring and another in summer and fall. In M37, similar patterns appear in steam use, but levels of chilled water consumption show no such seasonal difference.
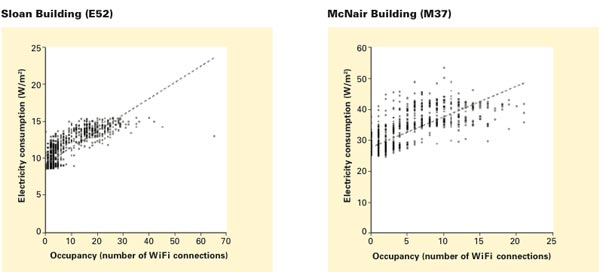
The next step was to examine the relationship between those energy-use patterns and variations in occupancy, using WiFi connections as a proxy. As shown in the figures below, electricity consumption in both buildings demonstrates a significant positive correlation with occupancy rate: WiFi connections can account for 69% of the variation in electricity levels in building E52 and for 63% in building M37. In contrast, the correlation between chilled water and steam use and human occupancy is weak, with WiFi connections accounting for only a small amount of the observed variation.
Electricity consumption versus occupancy, January 21–February 3, 2006

Results of an analysis of the correlation between electricity consumption and occupancy based on the full two weeks of data from which the hourly energy consumption curves (previous image) were extracted. In both MIT buildings, electricity use shows a significant positive correlation with occupancy rate (as measured by WiFi connections). A large proportion of electricity consumption remains constant over time. Even so, 69% of the variation in the Sloan Building (E52) and 63% of that in the McNair Building (M37) can be accounted for by changes in occupancy.
“We weren’t surprised to see that disconnect, but it’s good to be able to quantify it,” says Prudence Robinson, a DUSP research fellow in the SENSEable City Lab. And Ratti notes that the differing energy use profiles of the MIT buildings are themselves of interest. “It may be no more than a reflection of the different building construction and use,” he says. “Further inquiry would likely show all the buildings on campus have their own particular ‘signature.’ Knowing the signatures across the campus and across the seasons may be enlightening in determining appropriate operating strategies.”
Spreading the word, encouraging change
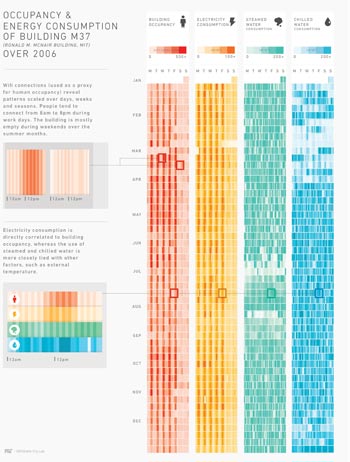
While continuing to gather and analyze data, the researchers are working to spread the word about energy/occupancy mismatching and the significant energy conservation opportunity solving this problem represents. For example, they are developing new ways to present their findings so that people can quickly comprehend what’s involved. The figure below demonstrates their latest data-presentation method. Skimming down a single vertical bar shows how that factor changes on a given day over a year; looking across a bar at one level shows how a particular factor changes over the course of a week; and comparing readings on the four bars at the same level quickly pinpoints where occupancy and energy use match and do not match.
Visualizing patterns of daily occupancy and energy consumption data for M37 over 2006

The team also offers some simple energy-saving rules for designing and using buildings. For example, grouping offices together can prevent the loss of heat from occupied, heated spaces to unoccupied, unheated ones. And at times, spaces can be designed to take advantage of “thermal seepage” through internal walls. For instance, that continuously heated lecture hall can be surrounded by heavily used offices so that someone benefits from the warm air even when the lecture hall is empty.
Finally, the group stresses the importance of behavioral change. Rex Britter, a DUSP research scientist in the lab, notes that encouraging people to change their habits may require some creative thinking. As an example, he describes a concept he calls the “weighted thermostat.” Picture a large meeting room. When many people are present, they can adjust the thermostat over a wide range to get the room to a comfortable temperature. But if only a few people are present, their ability to regulate the temperature would be more restricted. Over time, small groups would learn to use small rooms. Occupancy and energy use would be better matched, and less energy would be wasted.
“Behavioral change is a huge component that we haven’t even scratched the surface of,” says Robinson. “This is an area with lots of opportunity to do research—and enormous potential for making a real difference.”
This research was supported by a seed grant from the MIT Energy Initiative and by the National Science Foundation, the AT&T Foundation, the MIT SMART program, General Electric, Audi Volkswagen, Banco Bilbao Vizcaya Argentaria, Société Nationale des Chemins de fer Français, Ente Nazionale per l’Energia Elettrica S.p.A., and the members of the MIT SENSEable City Lab Consortium. Further information can be found in:
C. Martani, D. Lee, P. Robinson, R. Britter, and C. Ratti. “ENERNET: Studying the dynamic relationship between building occupancy and energy consumption.” Energy and Buildings, DOI: 10.1016/j.enbuild.2011.12.037, 2012.
This article appears in the Autumn 2012 issue of Energy Futures.